Worst April returns since 1970 but economy doing fine — Week of May 2, 2022

Strategy and Positioning written by Steve Orr, Chief Investment Officer; and Essential Economics written by Mark Frears, Investment Advisor
| index | wtd | ytd | 1-year | 3-year | 5-year | index level |
|---|---|---|---|---|---|---|
| S&P 500 Index | -3.26 | -12.92 | -0.52 | 13.83 | 13.63 | 4,131.93 |
| Dow Jones Industrial Average | -2.47 | -8.73 | -1.36 | 9.77 | 11.95 | 32,977.21 |
| Russell 2000 Small Cap | -3.94 | -16.70 | -17.95 | 6.70 | 7.21 | 1,864.10 |
| NASDAQ Composite | -3.92 | -21.00 | -11.80 | 16.10 | 16.44 | 12,334.64 |
| MSCI Europe, Australasia & Far East | -3.20 | -12.72 | -9.53 | 4.64 | 5.12 | 2,012.60 |
| MSCI Emerging Markets | -2.00 | -13.96 | -20.80 | 1.85 | 4.22 | 1,053.82 |
| Barclays U.S. Aggregate Bond Index | 0.50 | -9.04 | -7.96 | 0.55 | 1.30 | 2,142.21 |
| Merrill Lynch Intermediate Municipal | -0.07 | -8.10 | -7.50 | 0.37 | 1.54 | 294.19 |
As of market close April 29, 2022. Returns in percent.
Strategy & Positioning
— Steve Orr
Rate Ruin
Powell Pain continued last week for stocks as traders accepted the possibility of 0.5% and 0.75% rate increases in the coming months. Fed Chairman Powell gave life to Wall Street’s darker rate fears on the 21st when he opined that half-point rate increases “were on the table” for this Wednesday’s Fed meeting. This morning, Fed Funds futures suggest a near 100% chance of a 50-basis point (half of a percent) increase in short-term rates. Year-end futures are projecting nearly 2.72%, which suggests at least four 50bp increases over the remaining six meetings this year.
Inflation, however one measures it, is way beyond what the Fed expected. The Consumer Price Index has averaged 7.3% over the last six months. After a 0.5% increase this week, Fed Funds would average at least 0.75% this month. Three-quarters minus 7.3% equals a real interest rate of -6.55%. Rates are deeply negative, meaning that monetary conditions are incredibly loose. Historically, stocks do well when real rates are low to negative, and bonds fare well when real rates are positive, generally above 2%.
The journey from -8% real rates back to zero has just begun. Bond traders are trying their best to “help” the Fed get real rates back to neutral. The two-year Treasury yield has increased by a factor of ten over the last six months to a 2.68% yield and the 10-year Treasury yield has nearly doubled to 2.88%. These fast swings higher have dropped bond prices between 3% and 20%. The speed of interest rate rises over the last two months has impressed many observers and caused pain on statements. We would point out that higher rates almost immediately add income to the portfolio and result in higher long-term earnings.
Lower or Higher
If the CPI drops in half by the end of 2022, supply chains continue to heal and earnings margins can stay at record levels, then a Bull case can be made for the S&P 500’s current forward price earnings multiple of 18.2x. A year-end short rate of 2.75% with inflation of 4% still leaves real rates negative and favorable for stocks. Note that the two-year Treasury level today is below the year-end Fed Funds futures level. The two-year is a pretty reliable gauge of where short rates will be in a year. A lower two-year is telling us that markets think the economy may slow more than the Fed anticipates.
Risks to our forecast of lower inflation include elevated home prices, regulatory policies restricting oil and gas production, and overheating labor markets. Any or all can keep inflation numbers higher for longer and pressure the Fed to go too far in raising rates.
Yes, it’s late.
Higher inflation, rising interest rates and a possibly overheating jobs market check the boxes for a late-stage business cycle. The government shutdown, stimulus and recovery compressed a typical 5–7-year business cycle into perhaps 2.5 years. We are not convinced the Fed is aware of where the economy is in the current cycle. Mark digs into the details of the first quarter’s GDP below.
Another late cycle clue are business inventories and new orders. Inventories are building partly because supply chains are improving and partly because consumers are guarding their wallets against higher prices. New orders for manufacturing are continuing to increase, but at a slower pace. Markets are watching these classic late-cycle indicators and are trying to price future earnings.
The S&P 500 has gained 45% over the last three years but is down 2% over the last 12 months. Stocks rolling over in performance are also a late-cycle indicator. Digging into sectors and style, growth generally leads during expansions and value takes over near earnings peaks. Earnings growth appears to have peaked in the fourth quarter. On cue, the Russell 1000 Value index is down 6.7% this year, while its growth counterpart is down -20%.
A late-cycle economy does not have to endure a Bear stock cycle, however. Lower bond and stock prices at the same point in a cycle are rare in the post-World War II era. Most investors are accustomed to the low inflation / deflation regimen where bond prices rise to cushion stock prices falling. The rare periods when both rise or fall usually occur when the Fed is changing policy as we have seen today. The folks at Bespoke Research found six cases since 1977 where bonds fell at least 3% and stocks 5% in the same month. In all cases bonds were higher three and six months later. The S&P 500 was higher in most cases three months later and higher in every case a year later.
Still Good
Nearly half of the S&P 500 has reported through last Friday. Amazon missed on higher expenses and Twitter may have had its last earnings announcement. On balance, the first quarter continues to meet or exceed expectations. Earnings are on track to grow a healthy 9.4% and revenues 12.1% over 2021’s first quarter. Eight of 11 sectors are showing earnings gains, led by Energy’s 253%. Financials, dependent on big-bank merger and trading fees, trail at -18% growth.
Every sector but Utilities reports gains in revenue. 81% of companies have beat estimates to date, above the average 73%. On balance, the mega-tech names last week met expectations and posted sales gains. That was not enough for some traders who wanted big earnings surprises. In late-cycle expansions, big earnings beats are rare. This week 153 S&P 500 companies report, including fertilizer maker Mosaic, eBay, Clorox and Pioneer Resources.
Wrap-Up
April closes with the worst yearly start for stocks since 1950. Two Fridays in a row of large drops on large volume suggest we are near capitulation levels. The recent declines in both stocks and bonds look overdone in the face of a still-growing economy. Interest rates will still be at historically low and manageable levels after rate increases. Full employment, low rates and declining inflation in the coming months keep our indicators in neutral.
Essential Economics
— Mark Frears
Dig deeper.
Spring is here. I enjoy getting dirt on my hands, arms and in my shoes (well maybe not in my shoes). We are still replanting after the February 2021 freeze which killed most of our shrubs. The goal is to find vegetation that will survive the 100-degree days of July and August, while still making it through an occasional freeze. My wife also claims our soil is old and worn out. I think she was talking about the soil. So, we are digging out the old dirt in some beds and adding new soil. We will see if this digging deeper has benefits down the road.
Consumers and Businesses
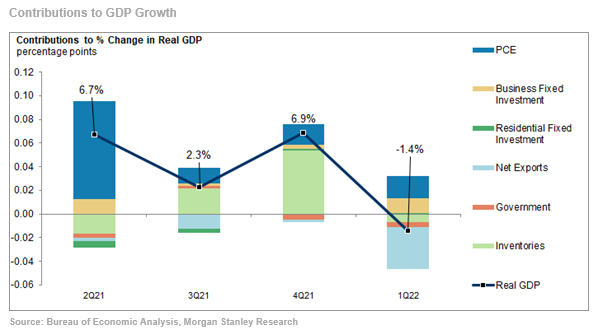
The single best metric for economic activity is Gross Domestic Product (GDP). Last week we saw results from the first quarter. The headline number was a negative 1.4%, but we need to dig deeper to get the full picture.
In the first quarter, we knew there were negative factors like inflation, Ukraine war and slowing government spending. So, while a negative number was unexpected, we can understand why we saw that. If we strip out foreign trade, inventory impact and government outlays, spending by businesses and consumers increased at a 3.7% annual pace! That is the fastest since the second quarter of 2021. In the chart below, you can see the significant impact of net exports on the quarterly release. We expect to see a reasonable bounce in the second quarter as the consumer balance sheet is still strong.
What are you buying?
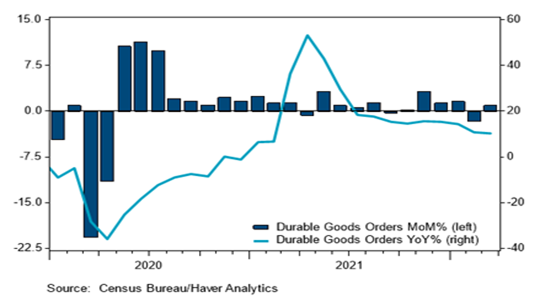
The preliminary March Durable Goods Orders showed an increase of 0.8%, up from February’s 1.7% decline. Looking a little deeper, the proxy for business investment, capital goods orders excluding defense and aircraft, was up a solid 1.0%. As you can see in the chart below, we are still struggling to get the year-over-year number back in positive territory.
Consumers had more cash according to March numbers, with income up 0.5%. Spending was up 1.1%, more than income, as pent-up Covid demand continued to drive consumption. Services spending was up the most since last July. Nondurable goods spending was up 2.5%, the second most in a year.
It costs how much?!
As we all know how much more it costs to fill up our vehicles, inflation is front of mind. The FOMC has favorites, just like you do, and when it comes to inflation, they prefer the Personal Consumption Expenditure (PCE) year-over-year (YoY) metric. Not to say they are not watching Consumer Price Index (CPI), but they publish forecasts based on PCE.
The PCE Deflator YoY for March came in at 6.6%, up from 6.3% last month. The Core PCE Deflator YoY came in at 5.2%, down from 5.3%. While these readings are still elevated from the 2% desired level, we should start to see these trend back down due to supply chain issues moderating and demand slowing.
How are you feeling?
Since our spending is three-quarters of GDP, it makes sense to dig deeper into our mindset. Let me be clear, I am not talking about spending time on the couch, talking about your feelings.
Last week, the Conference Board’s Consumer Confidence Index (CCI) for April was down slightly, but current expectations rose. This confidence indicator is driven more by the job situation and is still consistent with continued economic expansion.
The UoM Consumer Sentiment Index has more of an inflation focus and consequently has taken more of a hit than the CCI. The final April reading was up 5.8 points from the previous month, as gasoline prices moderated. The one-year and five to 10-year inflation expectations from the UoM survey are both below current inflation, reflecting the view that inflation should moderate over the intermediate term.
Wrap-Up
While we have dug into the dirt to see how the economy is doing, we are still seeing more spring flowers and fewer weeds.
| Upcoming Economic Releases: | Period | Expected | Previous | |
|---|---|---|---|---|
| 2-May | ISM Manufacturing | Apr | 57.6 | 57.1 |
| 2-May | ISM Prices Paid | Apr | 87.7 | 87.1 |
| 2-May | ISM New Orders | Apr | 54.1 | 53.8 |
| 2-May | ISM Employment | Apr | 55.0 | 56.3 |
| 3-May | Factory Orders | Mar | 1.2% | -0.5% |
| 3-May | JOLTS Job Openings | Mar | N/A | 11,266,000 |
| 3-May | Wards Total Vehicle Sales | Apr | 13,800,000 | 13,330,000 |
| 4-May | ADP Employment Change | Apr | 398,000 | 455,000 |
| 4-May | Trade Balance | Mar | -$106.7B | -$89.2B |
| 4-May | FOMC Announcement and Press Conference | 0.75-1.00% | 0.25-0.50% | |
| 5-May | Challenger Job Cuts YoY | Apr | N/A | -30.1% |
| 5-May | Nonfarm Productivity | Q1 | -3.8% | 6.6% |
| 5-May | Unit Labor Costs | Q1 | 7.5% | 0.9% |
| 5-May | Initial Jobless Claims | 30-Apr | 180,000 | 180,000 |
| 5-May | Continuing Claims | 23-Apr | 1,385,000 | 1,408,000 |
| 6-May | Change in Nonfarm Payrolls | Apr | 390,000 | 431,000 |
| 6-May | Change in Private Payrolls | Apr | 400,000 | 426,000 |
| 6-May | Unemployment Rate | Apr | 3.5% | 3.6% |
| 6-May | Average Hourly Earnings YoY | Apr | 5.5% | 5.6% |
| 6-May | Labor Force Participation Rate | Apr | 62.5% | 62.4% |
| 6-May | Underemployment Rate | Apr | N/A | 6.9% |
| 6-May | Consumer Credit | Mar | $25.000B | $41.820B |
Mark Frears is an Investment Advisor at Texas Capital Bank Private Wealth Advisors. He holds a Bachelor of Science from The University of Washington, and an MBA from University of Texas – Dallas.
Steve Orr is the Executive Vice President and Chief Investment Officer for Texas Capital Bank Private Wealth Advisors. Steve has earned the right to use the Chartered Financial Analyst and Chartered Market Technician designations. He holds a Bachelor of Arts in Economics from The University of Texas at Austin, a Master of Business Administration in Finance from Texas State University, and a Juris Doctor in Securities from St. Mary’s University School of Law. Follow him on Twitter here.
The contents of this article are subject to the terms and conditions available here.