Fed speeches wag market dog — Week of October 24, 2022

Strategy and Positioning written by Steve Orr, Chief Investment Officer; and Essential Economics written by Mark Frears, Investment Advisor
| index | wtd | ytd | 1-year | 3-year | 5-year | index level |
|---|---|---|---|---|---|---|
| S&P 500 Index | 4.75 | -20.27 | -16.25 | 9.56 | 9.72 | 3,752.75 |
| Dow Jones Industrial Average | 4.93 | -13.04 | -10.89 | 7.31 | 8.24 | 31,082.56 |
| Russell 2000 Small Cap | 3.57 | -21.59 | -23.15 | 5.22 | 4.22 | 1,742.24 |
| NASDAQ Composite | 5.22 | -30.14 | -28.06 | 11.19 | 11.42 | 10,859.72 |
| MSCI Europe, Australasia & Far East | 1.66 | -25.06 | -24.65 | -1.31 | -0.08 | 1,698.33 |
| MSCI Emerging Markets | 0.17 | -27.87 | -30.97 | -3.25 | -2.40 | 864.76 |
| Barclays U.S. Aggregate Bond Index | -1.12 | -16.78 | -16.15 | -4.02 | -0.76 | 1,959.99 |
| Merrill Lynch Intermediate Municipal | -0.21 | -9.63 | -8.96 | -1.20 | 0.71 | 289.28 |
As of market close October 21, 2022. Returns in percent.
Strategy & Positioning
— Steve Orr
Time-warp
Last week’s rally brought the big indices back up to month-ago levels. Over that span they endured a 7% swoon and some of the largest daily swings on record. The economy continues to slow back to trend levels, employment remains strong, and inflation is peaking. So why the volatility? Big swings in stock prices generally occur around earnings and other company-specific news. Lately, volatility has been more news driven. Traders are looking for any indication that may cause the Fed to slow down its rate increases.
Pulling out of the aforementioned swoon hinged on several FOMC members speaking about the possibility of the Fed slowing or pausing its rate increases. Traders bought stocks on the news, pushing stock data screens well into the green. The Fed meets Tuesday and Wednesday of next week. From last Friday through Wednesday the 2nd, Fed members are in “blackout,” not speaking to the press. Those speeches may have been the last indication of members’ thinking prior to the blackout. The months of hawkish “we are fighting inflation” rhetoric to the sudden switch to dovish talk about pauses or smaller rate increases make us wonder. Why the sudden excitement by traders, especially when the Fed’s forecast (the “dot plot”) says they would scale down the size of increases next year? Since stocks time-warped back a month in values, how about the Fed time-warp back to fighting inflation?
MARE
What fundamental changes would kill the current Bear cycle? For starters, economic data bottoming and turning higher. Coincident indicators like unemployment and industrial production remain strong. Leading indicators, however, point to elevated recession risk in the coming months. The index has fallen six of the last seven months. The six-month rate of change in the index is now -2.8%, which is the lowest level in a decade, outside of the pandemic shutdowns. The Conference Board noted in its press release that the downward trajectory in the Leading Economic Index implies “a recession is increasingly likely before year-end.” So, no help from the Conference Board.
How about inflation peaking? Housing prices and apartment rents generally take a year to work their way into the Consumer Price Index. As Mark explains this week, the Bureau of Labor Statistics samples rental rates every six months. The S&P Case-Shiller Home Price Index measures home prices in 20 metro areas monthly. It began rising a full year before CPI did, and in turn, the Fed waited a full year after CPI to begin raising rates. The Fed knows that interest rate increases can take a full year to work their way through the economy. Not so with mortgage rates. Rising mortgage rates have already pushed housing affordability to near-record lows. In turn, the Case-Shiller Home Price Index began falling this June. How long will it take the Fed to realize CPI will be rolling over in the coming months? Will the Most Anticipated Recession Ever occur before the Fed quits? We think the odds are yes it can, but we do not have a definitive estimate yet.
Somewhat okay
We do have reasonable estimates on earnings. To date, the third quarter earnings season is producing average beat rates — around three-quarters of reporting companies are beating analysts’ estimates. Only 20% of the S&P 500 members have reported, but earnings growth is running +1.5% year-over-year, above the -3% expected. A total of 159 members report this week and 164 next week, so by election day we will have a good sense of where the quarter stands. This is old-timers and new dogs’ week. GM, GE, Ford and Boeing along with Google, Apple and Meta will report.
Inflation and the surging value of the dollar have compressed margins in most reports. The dollar in particular hurts overseas sales. The dollar rose 25% since the summer of 2021 versus the G-20 basket of currencies. A number of countries have sold U.S. Treasuries to raise dollars in order to buy up their own currencies.
The Bank of Japan intervened in currency markets last Friday in a similar move to support the yen. We are not sure how much yen the Bank of Japan is willing to print but infinity is not the right answer. From 1985 to the end of last year, Japanese inflation has averaged 0.5%. This year it is averaging 1.9% and just hit 3%. We saw this movie back in the spring of 2021 when U.S. inflation jumped from 1.4% to 4%, on its way to 9.1% this June. One hopes the Bank of Japan saw our experience and took heed. A currency war or competitive devaluations would be the last thing companies and consumers need right now.
Wrap-up
October is almost in the books. We are ready for some candy corn and whatever new Reese’s product comes out for Halloween. October’s reputation for starting the best six months is so far intact; most stock indices are at least 5% higher. November is in view and our handy Stock Trader’s Almanac says that over the last 18 mid-term election years, the S&P 500 has risen 14 times. In the midst of a Bear cycle, war, inflation and rising rates, we would be happy to have history repeat itself.
Essential Economics
— Mark Frears
A place to lay your head
Over our lives, we go from living with a group (family), to being on our own in a dorm, apartment, or van, to potentially owning a house with our spouse and family, to downsizing, and possibly back to a group in an assisted living facility. Depending on where you are in this cycle, you have different demands/needs, and housing providers must consider these demographic trends.
Buyers
The number one concern for potential purchasers now is rates. We have seen the largest year-over-year change in 30-year fixed rate mortgages since 1981. As you can see below, while we have made a dramatic rise over a short timeframe, we are still below longer-term rates. People had become accustomed to very low rates and are now having to adjust their purchasing capacity.
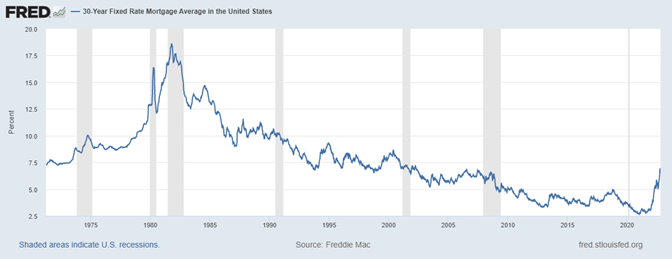
Source: fred.stlouisfed.org
The National Association of Realtors publishes a Housing Affordability Index, and it is essentially on top of a two-decade low.
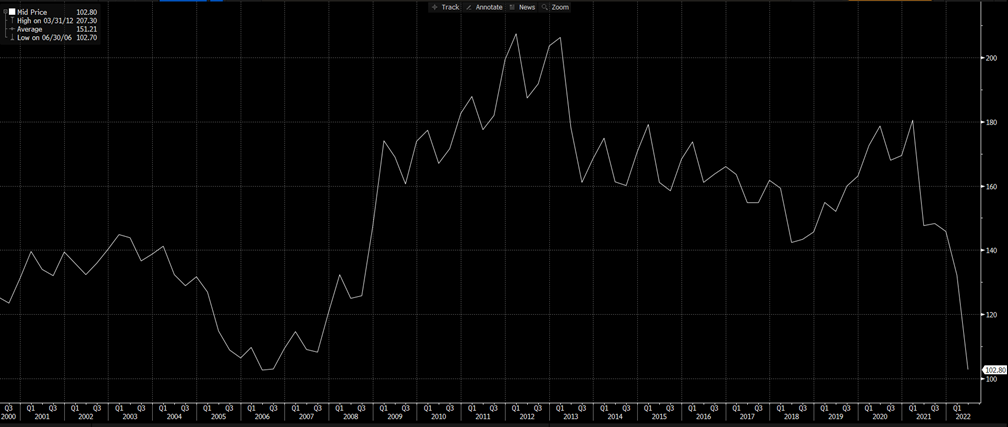
Source: Bloomberg
The second thing that buyers must consider is whether to rent. Given the still healthy labor market, people are looking to spend their hard-earned cash. As demand has been high for new/existing houses, the supply has not kept up. The near-term alternative is to rent. Unfortunately for the lessee, even as multi-family building has been a larger part of building, rents are high as well. Did you know you have to “bid up” the payment you will make to rent in many hot locations, as the competition is fierce?
Third, what type of home and location are important. According to Fannie Mae, only 19% of Americans believe it is a good time to buy a home, based on an April 2022 survey. Given that rates have risen dramatically since then, this is probably even lower now. While prices may be cooling in some of the hot markets, they are still elevated. Unless you want to buy/rent in Eagle River, Wisconsin, you might be best to sit and wait for lower prices and rates, especially as housing is generally the single largest element of a household’s budget.
Builders
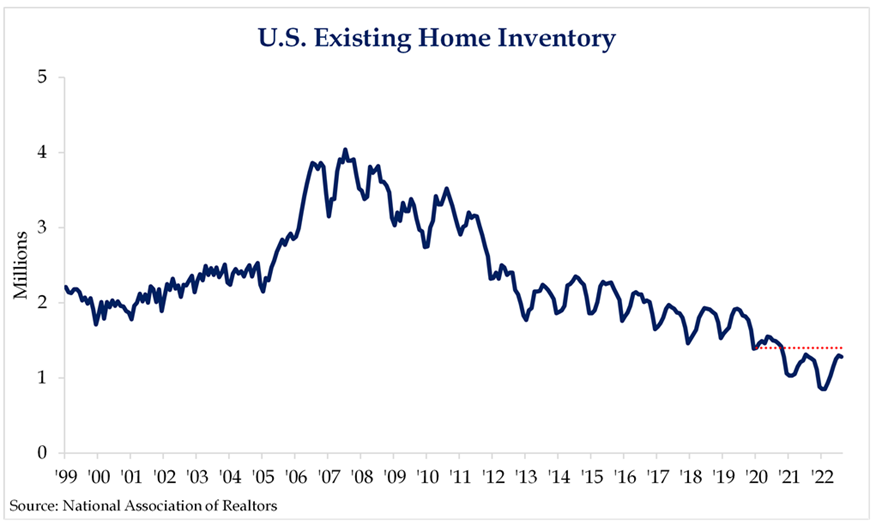
Providers of housing are in a quandary. While demand is slowing, as mortgage applications indicate, they are still behind the curve as inventories are still 10% below January 2020 levels.
While they see the need to increase inventories, higher mortgage rates, costs to build, and uncertainty as to which sector will see increased demand keep the builders pessimistic. The National Association of Home Builders (NAHB) Market Index is approaching pandemic levels.
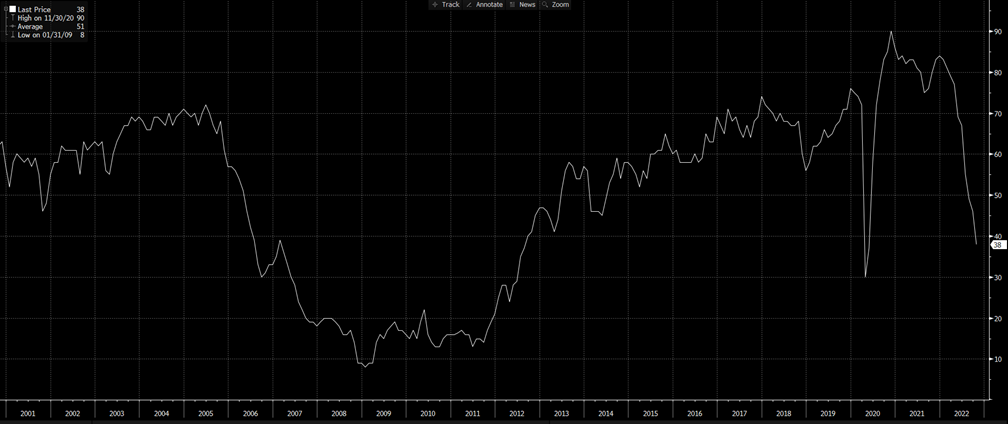
Source: Bloomberg
Bigger picture
Housing share of GDP is 16%, so this is a big deal for the overall economy. Consider all the parts of this industry that contribute to growth. Mortgage companies, land developers, electricians, plumbers, construction workers, architects, engineers and all the support personnel make up a big part of the workforce. This also impacts everyone who supplies materials used in construction.
When the buying/selling of homes slows down, for the various reasons we have cited, remodeling makes up some of the slack. People decide that if they can’t move to a better home, they will try to improve their existing one. This will help some pieces of this industry, but a much smaller portion.
The Fed is obviously a big player in this space. Given the high level of inflation, they are focused on slowing down the economy to reduce demand. As they continue to raise short-term rates, this shows they will go higher, and therefore longer-term rates (mortgages) will stay high until the Fed is closer to the end of the tightening cycle.
While the Fed’s primary tool is rates, their overall goal is to lower prices. The shelter component of the Consumer Price Index (CPI) makes up 33% of the total. Therefore, this area should be front-of-mind for the Federal Open Market Committee members. Owners Equivalent Rent (OER) makes up 24.3% of the shelter metric. Why is this important?
OER rolls in six-month cycles, so price increases from earlier in the year have yet to hit CPI. That’s the bad news, but we know from Case-Shiller and other data that home prices in most areas have/are rolling over. If you would swap out the month-over-month (MoM) changes of OER with the month-over-month changes in Case-Shiller 20-City Composite Home Price Index, CPI would already be negative MoM. The OER component in the winter/spring should be rolling over and turning negative.
Wrap-up
There is weakness in the housing sector, but this should provide an opportunity for builders to catch up and when rates turn south again, there should be inventory available. As far as the inflation picture, this will also allow for downward price adjustments and the CPI should reflect this, giving the Fed much needed progress in their battle against elevated inflation. Wondering what my next house will be like!
| Upcoming Economic Releases: | Period | Expected | Previous | ||
|---|---|---|---|---|---|
| 24-Oct | Chicago Fed Nat'l Activity Index | Sep | (0.10) | 0.00 | |
| 24-Oct | S&P Global US Manufacturing PMI | Oct | 51.0 | 52.0 | |
| 24-Oct | S&P Global US Services PMI | Oct | 49.5 | 49.3 | |
| 24-Oct | S&P Global US Composite PMI | Oct | 49.3 | 49.5 | |
| 25-Oct | FHFA House Price Index MoM S&P Corelogic 20-city house price | Aug | -0.6% | -0.6% | |
| 25-Oct | YoY | Aug | 14.10% | 16.06% | |
| 25-Oct | Conf Board Consumer Confidence | Oct | 105.3 | 108.0 | |
| 25-Oct | Conf Board Present Situation | Oct | N/A | 149.6 | |
| 25-Oct | Conf Board Expectations | Oct | N/A | 80.3 | |
| 25-Oct | Richmond Fed Manufacturing Index | Oct | (5) | 0 | |
| 26-Oct | Wholesale Inventories MoM | Sep | 1.0% | 1.3% | |
| 26-Oct | Retail Inventories MoM | Sep | 1.2% | 1.4% | |
| 26-Oct | New Home Sales | Sep | 580,000 | 685,000 | |
| 26-Oct | New Home Sales MoM | Sep | -15.3% | 28.8% | |
| 27-Oct | GDP Annualized QoQ | Q3 | 2.3% | -0.6% | |
| 27-Oct | Personal Consumption | Q3 | 0.9% | 2.0% | |
| 27-Oct | GDP Price Index | Q3 | 5.3% | 9.0% | |
| 27-Oct | Durable Goods Orders | Sep | 0.6% | -0.2% | |
| 27-Oct | Durable Goods ex Transportation Cap Goods Orders Nondefense ex | Sep | 0.1% | 0.3% | |
| 27-Oct | Air | Sep | 0.3% | 1.4% | |
| 27-Oct | Initial Jobless Claims | 22-Oct | 220,000 | 214,000 | |
| 27-Oct | Continuing Claims | 15-Oct | 1,383,000 | 1,385,000 | |
| 27-Oct | KC Fed Manufacturing Activity | Oct | (2) | 1 | |
| 28-Oct | Employment Cost Index | Q3 | 1.2% | 1.3% | |
| 28-Oct | Personal Income | Sep | 0.4% | 0.3% | |
| 28-Oct | Personal Spending | Sep | 0.4% | 0.4% | |
| 28-Oct | Real Personal Spending | Sep | 0.1% | 0.1% | |
| 28-Oct | PCE Deflator YoY | Sep | 6.3% | 6.2% | |
| 28-Oct | PCE Core Deflator YoY | Sep | 5.2% | 4.9% | |
| 28-Oct | Pending Home Sales MoM | Sep | -5.0% | -2.0% | |
| 28-Oct | UM (Go MSU) Consumer Sentiment | Oct | 59.6 | 59.8 | |
| 28-Oct | UM (Go MSU) Current Conditions | Oct | 65.0 | 65.3 | |
| 28-Oct | UM (Go MSU) Expectations | Oct | N/A | 56.2 | |
| 28-Oct | UM (Go MSU) 1-yr Inflation | Oct | 5.1% | 5.1% | |
| 28-Oct | UM (Go MSU) 5- to 10-yr Inflation | Oct | 2.9% | 2.9% |
Steve Orr is the Executive Vice President and Chief Investment Officer for Texas Capital Bank Private Wealth Advisors. Steve has earned the right to use the Chartered Financial Analyst and Chartered Market Technician designations. He holds a Bachelor of Arts in Economics from The University of Texas at Austin, a Master of Business Administration in Finance from Texas State University, and a Juris Doctor in Securities from St. Mary’s University School of Law. Follow him on Twitter here.
Mark Frears is an Investment Advisor at Texas Capital Bank Private Wealth Advisors. He holds a Bachelor of Science from The University of Washington, and an MBA from University of Texas – Dallas.
The contents of this article are subject to the terms and conditions available here.