Fed talking markets down; sentiment and outlook worse than reality — Week of April 25, 2022

Strategy and Positioning written by Steve Orr, Chief Investment Officer; and Essential Economics written by Mark Frears, Investment Advisor
| index | wtd | ytd | 1-year | 3-year | 5-year | index level |
|---|---|---|---|---|---|---|
| S&P 500 Index | -2.37 | -7.45 | 7.98 | 16.71 | 15.57 | 4,271.78 |
| Dow Jones Industrial Average | -0.38 | -4.68 | 4.05 | 11.67 | 13.46 | 33,811.40 |
| Russell 2000 Small Cap | -0.22 | -10.42 | -9.87 | 9.60 | 9.66 | 1,940.67 |
| NASDAQ Composite | -3.93 | -14.49 | -2.99 | 19.79 | 19.27 | 12,839.29 |
| MSCI Europe, Australasia & Far East | -0.27 | -8.34 | -3.98 | 6.42 | 6.83 | 2,126.64 |
| MSCI Emerging Markets | -0.67 | -8.85 | -14.27 | 3.63 | 5.77 | 1,086.93 |
| Barclays U.S. Aggregate Bond Index | -1.23 | -8.54 | -7.43 | 0.86 | 1.38 | 2,135.76 |
| Merrill Lynch Intermediate Municipal | -0.69 | -7.15 | -6.49 | 0.85 | 1.74 | 294.62 |
As of market close April 22, 2022. Returns in percent.
Strategy & Positioning
— Steve Orr
- Fed speakers jawbone markets lower
- Bond market swing looks too far to us; expect rates to moderate in coming weeks
- Leading Indicators suggest no recession in sight
- Jobless claims continue to hit all-time lows
Open Mouth
Earlier this month, Randall Forsyth, the Associate Editor of Barron’s, observed that the FOMC now stands for “Federal Open Mouth Committee.” Never in our memory have we seen a more “transparent” Fed. Committee members have been out in force this month, jawing about bigger rate increases. Chairman Powell’s speech last week about a half-percent increase “on the table” at the May meeting moved stocks back into correction territory.
Committee members Bullard and Daly also suggested three-quarters of a point increases could be considered. Wall Street dutifully ratcheted its rate increase forecasts higher. Nomura led the parade, calling for half of a point in May, and then two three-quarter point raises in June and July. That would push overnight rates to at least 2.25% by the end of July.
We thought at the beginning of the year that the global economy would slow down quicker than the Fed believed and that they would not raise rates as high as they projected. Our belief started with the fundamental backdrop of coordinated efforts by central banks to pull liquidity from markets (quantitative tightening) and raising interest rates. We did not factor in prolonged war or China causing a third supply chain wave with their zero COVID policy. Combined with countries hoarding cooking oil and grains, the rest of the world could slow to recession instead of a mild cooling.
It appears Powell and Company are trying to follow the 1994 playbook: hit markets hard early in the tightening cycle with bigger rate increases to move rates higher and cool down the economy. Markets believe there is a very high probability of half point increases at the May and June meetings. We understand the Fed is worried that its inflation fighting cred is on the line. If the Fed is truly “data driven,” it should pause in the summer and look hard at the incoming economic statistics. A recessionary Europe demanding liquidity from the Fed and below trend growth thanks to China shutdowns should factor in how far the Fed pushes rates in the fall.
Deflation
The Fed certainly is winning the inflation war in the public markets. Long-maturity bonds are deflating faster than most stocks. The 20-year maturity Treasury bond is down at least 17%, worse than the NASDAQ. Speaking of that tech-heavy index, Elon Musk’s bid for Twitter has not helped the social media group. After peaking in early February, the group is down over 52% this year.
Some wonder when we will return to “normal.” Few areas of the economy will return to pre-pandemic conditions as global trade turns regional, the population continues to age and developed countries push “decarbonization.” However, interest rates are doing their part to get back to pre-pandemic levels. The two-year Treasury is a good example:
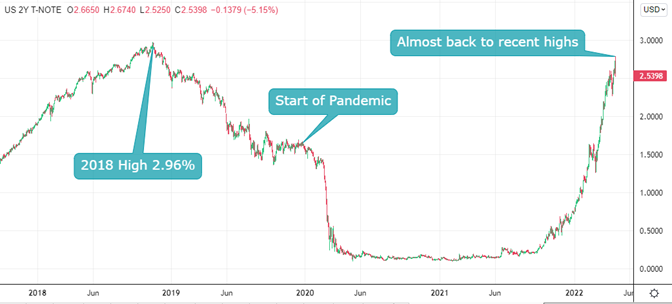
Note in the chart above that bond investors enjoyed the price gains on the way down from 2.97% to 0.14% during the pandemic. The rising rate pain has been more concentrated in the last couple of months versus the nearly two-year rally into the pandemic. The “U” shape of the two-year yield is not a typical chart pattern (understatement). We would point out that the left leg of the “U” was driven by the 20% increase in the money supply from Congress and the right leg is the resulting 10% inflation.
Stocks have made their own U-turn, with the last three weeks erasing an 11% rally for the S&P 500. That index, along with most of the other U.S. indices, sits 24% above its pre-pandemic high. Developed international stocks sit just 5% above their pre-pandemic high and Emerging Markets are 6% below.
We think most of the deflation pain for bonds is past. Stock prices will likely continue to struggle until the Fed’s rate path becomes clear later in the summer. That coincides neatly with the mid-term election pattern of stock volatility calming down in the fall.
What About?
The Fed jawboning rates higher and stocks lower took the focus away from earnings. One-fifth of the S&P 500 has reported to date. Fortunately, 79% have reported positive surprises over analysts’ estimates and 69% positive revenue surprises. When major trends are changing, one must pay extra attention to management’s statements. By far the majority are guiding analysts’ estimates “in-line,” meaning they are staying the course for the year’s outlook. Maintaining positive outlooks in the face of labor and commodity inflation means they are comfortable with margin pressures and future orders. The year-over-year beat rate of 6.6% (FactSet) is the lowest in the last two years, but not surprising given the sharp increases last year.
Bespoke Research points out that Apple, Alphabet, Amazon and Microsoft all report this week. That has happened less than 20% of the time in the last ten years. Unfortunately, when the MAGA group reports together, price reactions are usually weak. Over the next two weeks, 275 S&P 500 names report so we will have a good handle on earnings trends by the May 4 Fed meeting. This is stalwarts’ week, which is a nice way of saying old-timers. GE, Sherwin-Williams (remodeling activity?), Westinghouse, Boeing, McDonalds and ExxonMobil.
Wrap-Up
Markets are trying to price future Fed moves. Higher rates in the bond markets have already slowed housing demand. China’s lockdowns are causing a third supply chain crunch. War uncertainty will contribute to supply and demand shortages. In short, we think there are plenty of fundamental reasons the Fed slows down its rate increases in the fall and rates do not reach the market’s current projections.
Essential Economics
— Mark Frears
Are we there yet?
Last weekend I was on a trail, headed up 1100 feet to a magnificent lookout, or so I was told. This trail did not have any markers along the way, and I had never been on it before. There were multiple switchbacks that appeared to be an end point, but they just reversed higher in the other direction. After almost two miles, we saw sky ahead and reached the end, the turnaround. The view was so worth it! Markets are always looking for turning points, signs we are headed in the right direction.
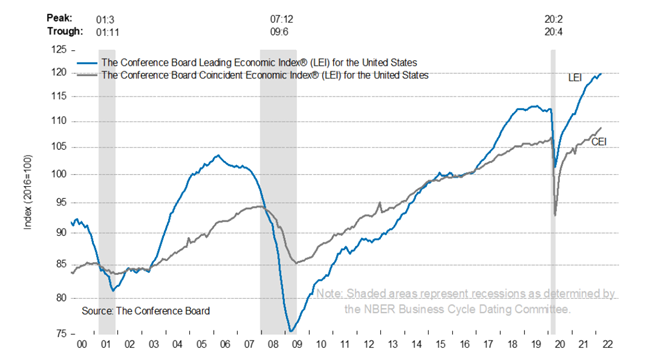
Leading Economic Index
Indicators can be grouped into lagging, coincident and leading. The Conference Board’s Leading Economic Index (LEI) covers employment, new manufacturing orders, building permits, equity prices, credit, interest rates and consumer expectations through 10 specific metrics.
As you can see in the chart below, the LEI (blue line) begins a downtrend prior to recessions, indicating a turning point. Currently the index continues to show a strong economy, despite geopolitical and inflationary concerns. In addition, the gap between current/coincident indicators and the leading indicators is very wide. This would tell you that while there may be concerns about where we are right now, the future looks bright.
The interest rate spread/curve the LEI monitors is the 10-year U.S. Treasury (UST) note less the overnight fed funds (FF) rate. While you are hearing lots of noise about inverted curves as the 10-year less two-year UST curve did go negative, this does not have the predictive power of the spread between 10-year UST and FF. This curve is currently at 241 basis points (bp) versus the last 10-year average of 134bp. This steepness and positive slope are good indicators of a strong economy. These indicators are not telling us it’s time to turn around yet!
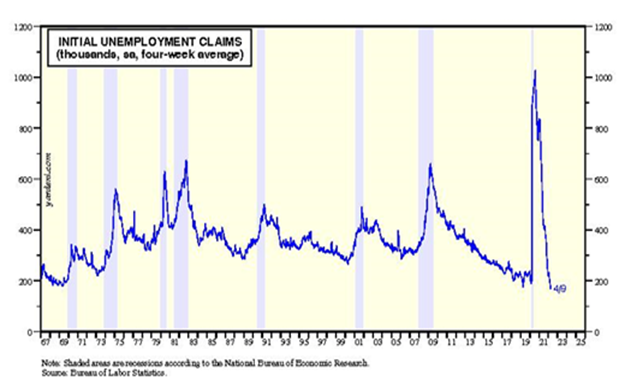
Jobless Claims
This statistic measures first-time claims for unemployment benefits; the chart below goes back to 1967. The first thing that stands out is the huge COVID bump. Recall that not only were many people out of work, but also the greater availability of benefits and the extended timeframe were part of the fiscal bailout. The other very significant data point is that current claims are at an all-time low. This would show we are close to full employment, with few people out of work. The current unemployment rate is 3.6%, very close to the pre-pandemic rate of 3.5%. This is giving the FOMC confidence in the strength of the economy, allowing them to focus on raising rates and removing accommodations to fight inflation. One caveat here is the number of job openings still available. The latest Job Openings and Labor Turnover Survey (JOLTS) showed over eleven million job openings! Where are the people who are going to fill these?
This latest measurement of jobless claims aligns with the monthly employment data that will be released in the first week of May. With continued low unemployment claims, we would expect a strong nonfarm payroll number. Current forecasts for this show an additional 325,000 jobs added to the economy, but we could see a higher number.
The shaded areas in the chart below indicate recessions. If we look at the trend in initial unemployment claims, they tend to make bottoms at the tail-end of business cycles.
The good news is that people are still spending, and specifically in categories where they could not while in COVID lockdown. Wages are increasing and there is still built-up savings for consumers to draw on. Job growth is strong, as shown by the payroll release for March, with eleven straight months of at least 400,000 jobs added to the economy. There are over eleven million job openings as indicated by the JOLTS report, so opportunities are available. Consumer and business balance sheets are strong, allowing for the economy to still move forward.
Expectations
The FOMC’s fight against inflation is pulling more weight now, but they will still be watching the economy, evaluating whether they are going too far, too fast. The much-watched year-over-year numbers for inflation should start to decline, as we compare back last March-April when inflation ticked higher. This was already happening before the Ukraine conflict. If the pace of change can start to slow, this will help show the FOMC’s vigilance and start to help the consumer.
Much of what the FOMC must fight is an ingrained inflationary mindset. This is not to say that actual costs are not rising — they are — but inflation is built on forward-looking expectations. If the markets can see the light at the end of the tunnel, future inflation expectations will begin to temper.
Wrap-Up
While the view from the mountaintop is amazing, the journeys, both up and down, carry risks. While we do not yet see that the U.S. economy has reached a turning point and started the downward path, we will continue to keep a close eye on our indicators.
| Upcoming Economic Releases: | Period | Expected | Previous | |
|---|---|---|---|---|
| 25-Apr | Chicago Fed Nat Activity Index | Mar | N/A | 0.51 |
| 25-Apr | Dallas Fed Manufacturing Activity | Apr | 4.5 | 8.7 |
| 26-Apr | Durable Goods Orders | Mar | 1.0% | -2.1% |
| 26-Apr | Durable Goods ex Transportation | Mar | 0.5% | -0.6% |
| 26-Apr | Cap Gds Orders Nondef ex Aircraft | Mar | 0.4% | -0.2% |
| 26-Apr | FHFA House Price Index MoM | Feb | 1.5% | 1.6% |
| 26-Apr | S&P House Price Index MoM | Feb | 1.50% | 1.79% |
| 26-Apr | S&P House Price Index YoY | Feb | 19.20% | 19.10% |
| 26-Apr | Conf Board Consumer Confidence | Apr | 108.0 | 107.2 |
| 26-Apr | Conf Board Present Situation | Apr | N/A | 153.0 |
| 26-Apr | Conf Board Expectations | Apr | N/A | 76.6 |
| 26-Apr | New Home Sales | Mar | 774,000 | 772,000 |
| 26-Apr | New Home Sales MoM | Mar | 0.3% | -2.0% |
| 27-Apr | Pending Home Sales MoM | Mar | -0.5% | -4.1% |
| 28-Apr | GDP Annualized QoQ | Q1 | 1.0% | 6.9% |
| 28-Apr | Personal Consumption | Q1 | 3.4% | 2.5% |
| 28-Apr | GDP Price Index | Q1 | 7.2% | 7.1% |
| 28-Apr | Initial Jobless Claims | 23-Apr | 180,000 | 184,000 |
| 28-Apr | Continuing Claims | 16-Apr | 1,400,000 | 1,417,000 |
| 29-Apr | Employment Cost Index | Q1 | 1.1% | 1.0% |
| 29-Apr | Personal Income | Mar | 0.4% | 0.5% |
| 29-Apr | Personal Spending | Mar | 0.7% | 0.2% |
| 29-Apr | Real Personal Spending | Mar | 0.0% | -0.4% |
| 29-Apr | PCE Deflator YoY | Mar | 6.7% | 6.4% |
| 29-Apr | PCE Core Deflator YoY | Mar | 5.3% | 5.4% |
| 29-Apr | UM (Go MSU) Consumer Sentiment | Apr | 65.7 | 65.7 |
| 29-Apr | UM Current Conditions | Apr | N/A | 68.1 |
| 29-Apr | UM Expectations | Apr | N/A | 64.1 |
| 29-Apr | UM 1 year Inflation expectations | Apr | N/A | 5.4% |
| 29-Apr | UM 5-10 year Inflation expectations | Apr | N/A | 3.0% |
Mark Frears is an Investment Advisor at Texas Capital Bank Private Wealth Advisors. He holds a Bachelor of Science from The University of Washington, and an MBA from University of Texas – Dallas.
Steve Orr is the Executive Vice President and Chief Investment Officer for Texas Capital Bank Private Wealth Advisors. Steve has earned the right to use the Chartered Financial Analyst and Chartered Market Technician designations. He holds a Bachelor of Arts in Economics from The University of Texas at Austin, a Master of Business Administration in Finance from Texas State University, and a Juris Doctor in Securities from St. Mary’s University School of Law. Follow him on Twitter here.
The contents of this article are subject to the terms and conditions available here.