Stocks need a spring break from this rally — Week of March 11, 2024

| index | wtd | ytd | 1-year | 3-year | 5-year | index level |
|---|---|---|---|---|---|---|
| S&P 500 Index | -0.23 | 7.73 | 32.84 | 11.47 | 15.19 | 5,123.69 |
| Dow Jones Industrial Average | -0.85 | 3.21 | 22.65 | 8.96 | 11.10 | 38,722.69 |
| Russell 2000 Small Cap | 0.34 | 2.97 | 15.78 | -1.17 | 7.89 | 2,082.71 |
| NASDAQ Composite | -1.15 | 7.31 | 43.07 | 8.03 | 17.79 | 16,085.11 |
| MSCI Europe, Australasia & Far East | 2.51 | 5.86 | 18.12 | 5.73 | 8.44 | 2,357.74 |
| MSCI Emerging Markets | 1.24 | 1.54 | 10.34 | -4.99 | 2.96 | 1,037.09 |
| Barclays U.S. Aggregate Bond Index | 0.81 | -0.50 | 4.70 | -2.51 | 0.70 | 2,151.22 |
| Merrill Lynch Intermediate Municipal | 0.31 | 0.10 | 4.88 | -0.05 | 1.85 | 315.19 |
As of market close March 11, 2024. Returns in percent.
Investment Insights
— Steve Orr
Brown out
Perhaps we were a couple of weeks early on hitting pause. Our recent missives have pointed out that sentiment and valuation were pegged at maximum on our dashboard, and it was time to be cautious. A back-and-forth week that left the S&P 500 basically unchanged may be a prelude, not a pause. The primary trend direction remains higher. The forces of plentiful liquidity, a Fed leaning toward lower rates (someday) and frothy optimism remain intact.
The NASDAQ retreated for the second time in the past nine weeks. The NASDAQ is home to the “Magnificent 7” mega-cap tech companies that have powered the U.S. market for the past 18 months. We offer this public service announcement: Those 18 months have been enjoyable for our equity clients, but all cycles do turn. The “Mag 7” are finally starting to go their own way.
A quick rundown: Telsa is off 14% from its highs, thanks to falling interest in EVs and stiff competition in China. Apple and Alphabet (Google) are down 5% and 2% this month on lagging sales. Microsoft and Amazon are also slightly down to flat this month. The two darlings of the month are NVIDIA (“officially Bonkers” hat tip Cameron Crise) at +10% and Meta (Facebook) up 3%. These are pittance returns compared to the group over the past six months:
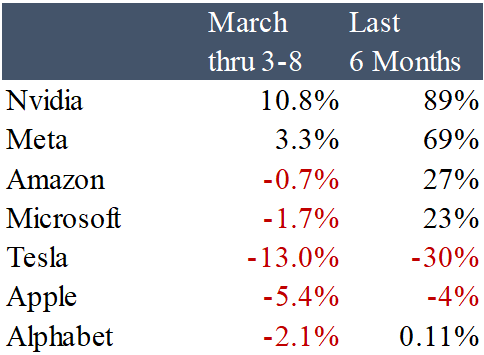
NVIDIA, trading at 20 times 2024 estimated sales, will have to sell an amazing number of AI and video chips to meet Wall Street hopes. The rest of the list have sound businesses but may be suffering from rally fatigue. Call it rally brownout for now. We regularly hear 1999 comparisons with the dot.com blowoff rally. We get the idea but would point out that these companies actually produce stuff and sell it. As an example, Broadcom’s CEO was on the tape last week upping their AI chip revenue from 25% of their $10 billion chip sales to 35%. Broadcom toplined $35 billion last year, and the Street thinks it can make $50 billion this year.
Mid Cap companies have been largely forgotten in the AI and Mag 7 memes. Super Micro makes AI servers and other components. It has bounced +31% this month thanks to NVIDIA-style sales forecasts. Chemours and MasTec have also helped Mid Cap stocks have some life and actually do better than their large cousins this month. Perhaps the rally cycle will extend further into the year than we thought.
Blowout, sort of
Another month, another big jobs headline. February’s non-farm payroll increase of 275,000 jobs handily beat expectations of 200,000. This report continues a thread from the past several months. Gains were confined to healthcare and government offset by declines in manufacturing, retail and trade sectors (cyclicals). The prior two months had large downward revisions totaling167,000 jobs. So, nice headline, but mixed details. We would note that 100,000 or so net new jobs a month are a minimum to keep the economy at stable employment.
The Household survey showed a very different path for job growth. The number of employed persons declined by a net (adjusted) 184,000. This pushed the unemployment rate up to 3.9% from 3.7%. Not a trend change, but since the participation rate barely moved, it indicates an increase in unemployed (+334,000) people. Remember, the Fed is OK with unemployment rising to around 4.5%. That would cut the number of job openings and reduce pressure on wage inflation, in their view. It also would mean another 1.2 million unemployed. That is not good for the economy.
Punch out
While gold, bitcoin and stocks rally higher to start the year, bonds have quietly built a trading range. On one hand, the deficit spending by the administration is bringing supply that should push U.S. Treasury prices lower. This year’s projected $2 trillion in deficit spending will equate to 7% of GDP. This is unheard of outside of wartime borrowing needs. Holding prices up, and rates lower than they should be, are hopes of the Fed cutting short-term rates and a flight to quality from geopolitical issues.
Fed Chairman Powell’s testimony to Congress last week did not reveal any new insights to the Fed’s thinking. They are waiting for inflation to get closer to 2% before cutting rates. This week marks the two-year anniversary of the first rate hike of this cycle. Powell can do a victory lap having avoided a recession over the past two years. Let’s just make sure he understands the fiscal levers that the administration pulled while he and the FOMC were pulling their monetary lever. Over the past two years, the administration has pushed the federal debt $4.3 trillion higher, sold down the Strategic Petroleum Reserve, run down the Treasury General Account and canceled roughly $140 billion of student loan debt. These tactics have either put money directly in people’s pockets or kept more dollars in the financial system than are necessary.
Which brings us back to stocks, jobs and rates. The 10-year Treasury has dropped three-tenths of a percent in the past 12 trading days. That is not a fast move in recent history as the chart below shows. Still, the path since December has been higher yields, lower prices. Some of that trend was driven by economic data and fourth quarter earnings coming in better than expected.
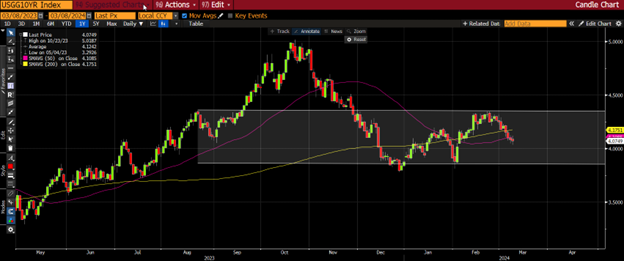
Source: Bloomberg
The shaded white area shows the recent range from December. Moving between recent highs and recent lows is usually a sign of a trendless market. The steady march lower in yield the past few days punched through both the 50- and 200-day moving average. We are on watch for an outside event, say a sinking in the Red Sea, or change in Ukraine, to push rates lower. Oh wait, a ship sank in the Red Sea last week and we are not sure if anyone noticed.
The two-year Treasury shows a similar pattern the past several weeks, except that it is caught in “no man’s land” between the 50- and 200-day averages. Twos are usually a good indicator of where markets think Fed Funds will be a year from now. At a recent 4.45%, that implies at least three quarter-point cuts sometime in the next 12 months. Put us down for after the election.
Wrap-up
The headliner stocks need a break. Job growth is not that great under the surface. Rates markets may be sniffing the slowdown we have been talking about for the past three months.
This is the fun week for economists. Consumer prices, retail sales and University of Michigan sentiment should tell a slightly weaker story than last quarter. The CPI should show inflation sticking above 3%. Overall, more of the same, and no reason to change ships in the middle of the ocean.
Steve Orr is the Managing Director and Chief Investment Officer for Texas Capital Bank Private Wealth Advisors. Steve has earned the right to use the Chartered Financial Analyst and Chartered Market Technician designations. He holds a Bachelor of Arts in Economics from The University of Texas at Austin, a Master of Business Administration in Finance from Texas State University, and a Juris Doctor in Securities from St. Mary’s University School of Law. Follow him on Twitter here.
The contents of this article are subject to the terms and conditions available here.
Texas Capital Private Bank™ refers to the wealth management services offered by the bank and non-bank entities comprising the Texas Capital brand, including Texas Capital Bank Private Wealth Advisors (PWA). Nothing herein is intended to constitute an offer to sell or buy, or a solicitation of an offer to sell or buy securities.
Investing is subject to a high degree of investment risk, including the possible loss of the entire amount of an investment. You should carefully read and review all information provided by PWA, including PWA’s Form ADV, Part 2A brochure and all supplements thereto, before making an investment.
Neither PWA, the Bank nor any of their respective employees provides tax or legal advice. Nothing contained on this website (including any attachments) is intended as tax or legal advice for any recipient, nor should it be relied on as such. Taxpayers should seek advice based on the taxpayer’s particular circumstances from an independent tax advisor or legal counsel. The wealth strategy team at PWA can work with your attorney to facilitate the desired structure of your estate plan. The information contained on this website is not a complete summary or statement of all available data necessary for making an investment decision, and does not constitute a recommendation. The information has been obtained from sources considered to be reliable, but we do not guarantee that the foregoing material is accurate or complete. Any opinions are those of the authors and not necessarily those of PWA or the Bank.
©2025 Texas Capital Bank Wealth Management Services, Inc., a wholly owned subsidiary of Texas Capital Bank. All rights reserved.
Texas Capital Bank Private Wealth Advisors and the Texas Capital Bank Private Wealth Advisors logo are trademarks of Texas Capital Bancshares, Inc., and Texas Capital Bank.
www.texascapitalbank.com Member FDIC NASDAQ®: TCBI