Shorts covered, rates higher for longer — Week of November 21, 2022

Strategy and Positioning written by Steve Orr, Chief Investment Officer; and Essential Economics written by Mark Frears, Investment Advisor
| index | wtd | ytd | 1-year | 3-year | 5-year | index level |
|---|---|---|---|---|---|---|
| S&P 500 Index | -0.61 | -15.61 | -14.38 | 10.08 | 10.90 | 3,965.34 |
| Dow Jones Industrial Average | 0.11 |
-5.41 |
-3.97 | 8.75 | 10.00 | 33,745.69 |
| Russell 2000 Small Cap | -1.70 | -16.64 | -20.69 | 6.28 | 5.71 | 1,849.73 |
| NASDAQ Composite | -1.50 | -28.21 | -29.72 | 10.09 | 11.48 | 11,146.06 |
| MSCI Europe, Australasia & Far East | 0.27 | -15.01 | -15.41 | 2.00 | 2.55 | 1,922.38 |
| MSCI Emerging Markets | 0.80 | -21.27 | -23.57 | -1.13 | -0.98 | 943.01 |
| Barclays U.S. Aggregate Bond Index | 0.48 | -13.69 | -13.48 | -2.92 | -0.07 | 2,032.61 |
| Merrill Lynch Intermediate Municipal | 1.34 | -7.97 | -7.59 | -0.62 | 1.13 | 294.59 |
As of market close November 18, 2022. Returns in percent.
Strategy & Positioning
— Steve Orr
Needed break
The Halloween rally finally ran out of steam last week. Traders had plenty of reasons to clean up trade blotters: expiration of volatility futures, stock and index option expiration and, hopefully, a light holiday week. Since options expired last week, flows suggested a lot of short positions got covered. One would expect heavily shorted stocks would have done well last week, but that was not the case. The Goldman Sachs Most Shorted index has barely budged.
Most S&P sectors remain in overbought territory, especially energy, staples and health care. An old-timer’s view of stocks is that they run to overbought then slide to oversold. True enough, but it’s not a very helpful nostrum to someone who just wants to know what is going to happen next. Other markets suggest sitting tight and waiting for more bottom evidence.
Who says?
Risk assets and their funding sources tend to move in tandem. So too volatility in this environment. The Goldman Sachs Most Shorted index mentioned above is a good example. Note the divergence between the S&P and GSMS index in the oval. Compare that divergence to the price action for most of this year. Over a few weeks the S&P “catches down” to the most shorted index.
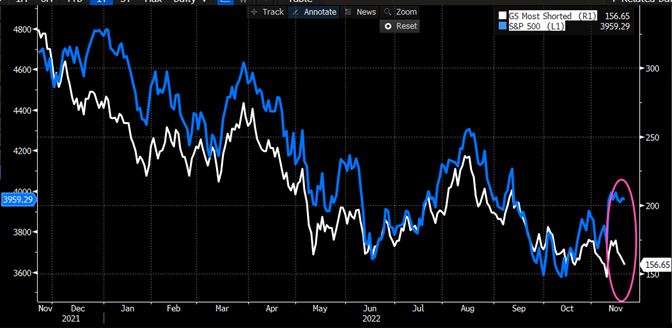
Source: Bloomberg L.P., Goldman Sachs
The Yuan and Yen charts have similar divergences to stocks. Bitcoin and the VIX index have the same “gap.” These cross-asset class relationships do have a say in whether the stock rally gets back in gear.
How far?
The trading narrative in September and October bounced between the Fed not stopping and the expectation that the Fed would soon “pivot” and stop raising rates. Just as the Fed was behind in reacting to the rising CPI, Wall Street has been behind the Fed’s rhetoric. Recent FOMC speeches focus on the possibility of smaller increases but rates ultimately rising higher and staying high longer than people expect. We take the Fed at their word.
Factoring in the six-month survey lag for home prices and rents, it is hard to see CPI inflation breaking below 5% over the next several months. Remember, too, October’s 7.7% number was reduced by 0.5% due to health care cost seasonal adjustments. Health care prices will get a booster shot next spring when higher insurance premiums are factored in. Housing lag and health care adjustments mean inflation numbers may take longer to roll over than markets expect. Add the fact that the Fed has never stopped increasing rates until the nominal Fed Fund level was above CPI. The futures pits expect Fed Funds to peak in June and for the Fed to cut rates by nearly a half of a percent by the end of 2023. That sounds like a recession to us.
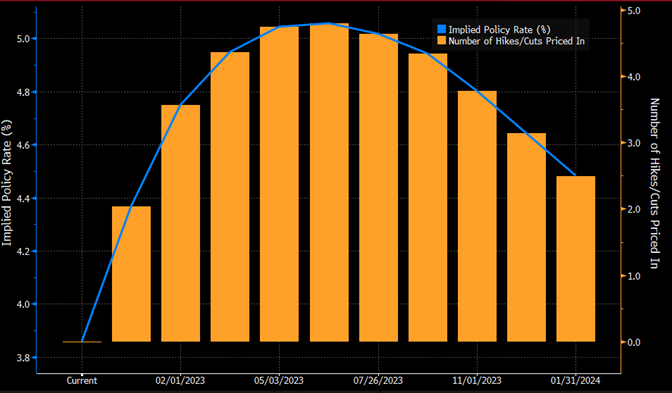
Source: Bloomberg L.P.
Here is a summary of Wall Street analyst projections:
| PEAK | END OF 2023 | |
| Nomura Holdings | 5.75% | 5.00% |
| Citi | 5.50% | 5.50% |
| Goldman Sachs | 5.50% | 5.25% |
| Wells Fargo | 5.25% | 5.25% |
| Bank of America | 5.25% | 5.25% |
| Barclays | 5.25% | 4.50% |
| JPMorgan Chase | 5.00% | 5.00% |
| Bloomberg Economics | 5.00% | 5.00% |
| Deutsche Bank | 5.00% | 4.00% |
| UBS | 5.00% | 3.25% |
| Morgan Stanley | 4.75% | 4.50% |
Source: Bloomberg, Firms listed
Deutsche and UBS are the most downbeat, thinking that the Fed will have to act fast in the back half of 2023 to lessen the blow of high rates. Our data puts our forecast closer to Goldman and Citi: peaking at or above 5.5% mid-2023 and staying there for most of the rest of the year.
The rest
To paraphrase Paul Harvey, “What is the rest of the story?” Yes, Fed rate increases have knocked housing down. Existing home sales are down 28% year-over-year. Mortgage origination is down over 40%. Fed rate increases affect the cost of funds for everyone and everything. The effective rate felt by the economy is a combination of the Fed Funds target range, today 3.75% to 4%, the Fed’s balance sheet reduction, lending standards and the U.S. dollar.
The Fed’s Quantitative Tightening program has dropped the bond portfolio by $400 billion this year. Still a long way to go to cut out the shutdown borrowing by Congress of $3.8 trillion, but it’s a start. QT cuts market liquidity probably close to one percent over the next year. Tighter lending standards, borrowing spreads and a strong U.S. dollar add another half percent. Back of the envelope, the economy is facing a monetary policy impact of close to 5.5% today. A research paper issued by the San Francisco Fed estimated it to be above 5.25% in September.
Wrap-up
Monetary conditions are tightening faster than nominal Fed Funds suggest. The economy is slowing, and companies are warning of slowing earnings growth. We would welcome a typical seasonal rally, but markets have a lot of headwinds with which to contend. Our indicators have yet to turn green and we remain on the sidelines.
Essential Economics
— Mark Frears
How much
There is about to be a lot of activity around our house. The annual Christmas decoration extravaganza! We have a shed in the backyard that is half full of trees, decorations, garland, wreaths and who knows what else. My wife likes Christmas decorations. She comes by it honestly, as her father was a true specialist in the field. There will be five trees up in our house, from the 4-foot ones in the boys’ rooms to the two in the den, to the one in the kitchen, and we don’t live in a big house! You get the picture. Economic activity is measured in Gross Domestic Product (GDP).
Current
As you have heard before, our spending makes up two-thirds of GDP. We are a huge part of what drives the U.S. economy. The actual calculation of GDP includes four components: consumption of households, government spending, investment by businesses and net exports.
Retail sales came out last week, indicating the consumer is alive and well. Most people are still doing well, in spite of the Fed increasing short-term rates in an attempt to slow demand. The key will be the labor market. As long as the consumer feels confident in their employment and their ability to find another job if the current one ends, they will continue to spend.
You have seen some slowdown in spending in the housing market, and this flows through to numerous businesses. Car loan rates are also creeping up, potentially causing buyers to postpone purchases. Credit card rates are also climbing, and this will take a bigger bite out of the budget. As inflation is still elevated, this takes a chunk out of the tighter budget for those working paycheck-to-paycheck.
As the apparent outcome in D.C. is gridlock, this will slow any increase in government spending as well. Businesses will spend as long as consumers are buying, so expect to see a slowdown there in the not-too-distant future. The strong U.S. dollar has made exporting more difficult as it costs countries more to buy our goods. We could see this start to turn in 2023, providing a boost for GDP.
We should see positive GDP to end the year, but there is concern looking into 2023.
Growth
There are two significant drivers of GDP growth that are currently running below five-year averages. In the chart below you can see how productivity and labor force growth are not keeping up.
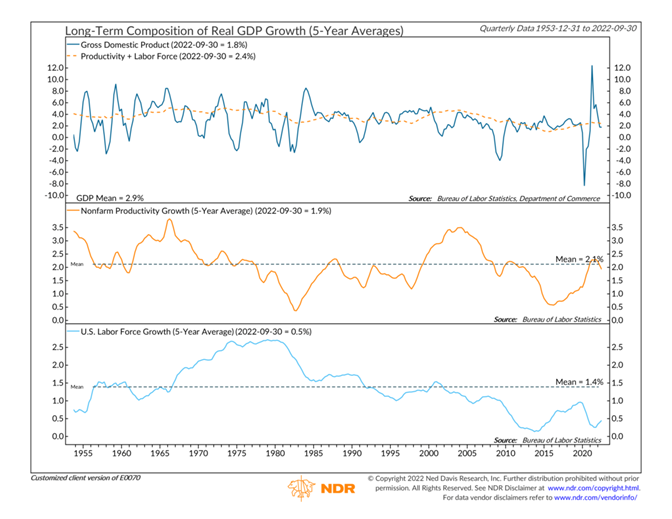
First of all, nonfarm productivity growth is defined as the annualized change in efficiency when producing goods and services, excluding farming industry. There are a couple of schools of thought here as to why this is running below longer-term averages. One, the technology advantages we have seen have been tapped out and they no longer increase our efficiency. I think we will continue to see technology drive efficiency. Two, the worker no longer works as hard. This has been highlighted lately in the “quiet quitting” theory, where workers are not working as hard because they don’t have to. Possibly the very robust labor market is driving some of this, but as the market tightens, accountability will come into play.
Second, the labor force is not growing as fast. Baby boomers are retiring, some decrease is due to pandemic impact and the legal immigration has slowed to a crawl. Unless we see more workers come back into the workforce, this will continue to be a drag on GDP growth.
Recession
The other thing that GDP is used for is defining recessions. The classic definition is two consecutive quarters of negative GDP growth. We have already seen that in Q1 and Q2 2022! Did it feel like a recession? Not to most.
The U.S. Treasury Curve is also an indicator of what is to come. The best predictor of upcoming recessions is the spread between the 3-month U.S. Treasury Bill and the 10-year U.S. Treasury note. The underlying assumption here is that longer-term rates should be higher than short-term in a healthy economy, as you expect things to cost more in the future. As you can see below, the 10-year is now 41 basis points (0.41%) below the 3-mo rate, indicating a recession sometime in the next 6 to 12 months.
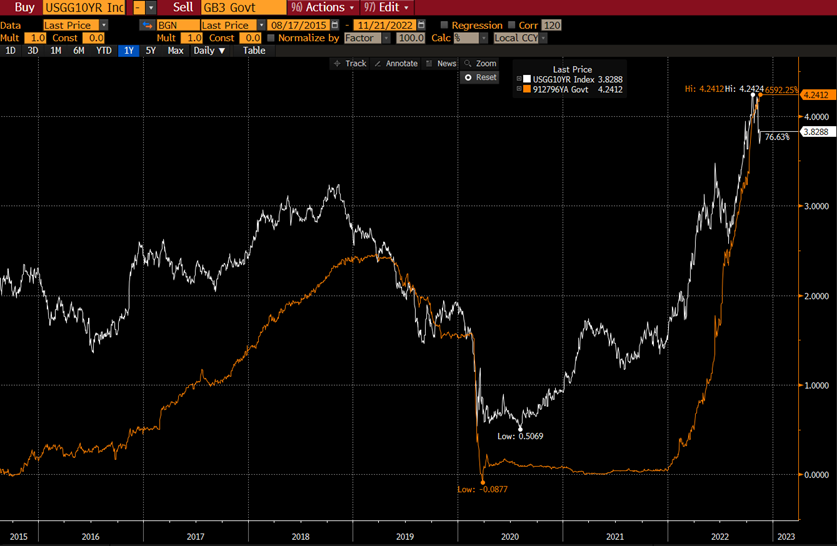
Source: Bloomberg
Wrap-up
In your sphere of influence, you may not be seeing evidence of a slowing economy, and there is still a lot of strength in the underlying economy. The fact is that as the Fed continues to raise rates, it will have an impact on the labor market, eventually, and will cause the economy to slow. Hard to tell if we will have a soft or hard landing, but some pain is ahead. It is a certainty I will have some back pain in carting all the Christmas trees into the house!
| Upcoming Economic Releases: | Period | Expected | Previous | |
|---|---|---|---|---|
| 21-Nov | Chicago Fed National Activity Index | Oct | (0.03) | 0.10 |
| 22-Nov | Richmond Fed Manufacturing Index | Nov | (8) | (10) |
| 23-Nov | MBA Mortgage Applications | 18-Nov | N/A | 2.7% |
| 23-Nov | Durable Goods Orders | Oct | 0.4% | 0.4% |
| 23-Nov | Durable Goods ex Transportation | Oct | 0.1% | -0.5% |
| 23-Nov | Cap Goods Orders Nondef ex Air | Oct | 0.2% | -0.4% |
| 23-Nov | Initial Jobless Claims | 19-Nov | 225,000 | 222,000 |
| 23-Nov | Continuing Claims | 12-Nov | 1,520,000 | 1,507,000 |
| 23-Nov | S&P Global US Manufacturing PMI | Nov | 50.0 | 50.4 |
| 23-Nov | S&P Global US Services PMI | Nov | 48.0 | 47.8 |
| 23-Nov | S&P Global US Composite PMI | Nov | 48.0 | 48.2 |
| 23-Nov | UofM (Go MSU) Consumer Sentiment | Nov | 55.0 | 54.7 |
| 23-Nov | UofM (Go MSU) Current Conditions | Nov | 57.8 | 57.8 |
| 23-Nov | UofM (Go MSU) Expectations | Nov | 52.7 | 52.7 |
| 23-Nov | UofM (Go MSU) 1-yr inflation | Nov | 5.1% | 5.1% |
| 23-Nov | UofM (Go MSU) 5-10-yr inflation | Nov | 3.0% | 3.0% |
| 23-Nov | New Home Sales | Oct | 570,000 | 603,000 |
| 23-Nov | New Home Sales MoM | Oct | -5.5% | -10.9% |
| 23-Nov | FOMC Meeting Minutes from Nov 2 | |||
| 24-Nov | Happy Thanksgiving!! |
Steve Orr is the Executive Vice President and Chief Investment Officer for Texas Capital Bank Private Wealth Advisors. Steve has earned the right to use the Chartered Financial Analyst and Chartered Market Technician designations. He holds a Bachelor of Arts in Economics from The University of Texas at Austin, a Master of Business Administration in Finance from Texas State University, and a Juris Doctor in Securities from St. Mary’s University School of Law. Follow him on Twitter here.
Mark Frears is an Investment Advisor, Executive Vice President, at Texas Capital Bank Private Wealth Advisors. He holds a Bachelor of Science from The University of Washington, and an MBA from University of Texas – Dallas.
The contents of this article are subject to the terms and conditions available here.