Nice rally, but markets range bound — Week of September 12, 2022

Strategy and Positioning written by Steve Orr, Chief Investment Officer; and Essential Economics written by Mark Frears, Investment Advisor
| index | wtd | ytd | 1-year | 3-year | 5-year | index level |
|---|---|---|---|---|---|---|
| S&P 500 Index | 3.68 | -13.72 | -8.11 | 12.75 | 12.52 | 4,067.36 |
| Dow Jones Industrial Average | 2.72 | -10.16 | -5.92 | 8.37 | 10.46 | 32,151.71 |
| Russell 2000 Small Cap | 4.07 | -15.41 | -15.27 | 8.17 | 7.45 | 1,882.85 |
| NASDAQ Composite | 4.15 | -22.14 | -19.95 | 15.41 | 14.82 | 12,112.31 |
| MSCI Europe, Australasia & Far East | 0.91 | -19.11 | -19.95 | 2.20 | 1.97 | 1,838.80 |
| MSCI Emerging Markets | -0.13 | -19.24 | -22.89 | 1.43 | 0.37 | 970.29 |
| Barclays U.S. Aggregate Bond Index | -0.64 | -11.51 | -12.39 | -1.97 | 0.29 | 2,083.96 |
| Merrill Lynch Intermediate Municipal | -0.09 | -7.56 | -7.75 | -0.56 | 1.07 | 295.92 |
As of market close September 9, 2022. Returns in percent.
Strategy & Positioning
— Steve Orr
Head fake?
Stocks up, bonds down. Last week was a nice break after three weeks and drops of 8% to 10% in major markets. We are slightly encouraged by the recent higher lows put in by most stock indices. Stepping back markets have worked into trading ranges. “Mucking around” without trend.
The S&P 500’s recent range from 3,750 to 4,350 adds to the sideways action that started in late July. The big index is down just 1.6% from July 28 through last Friday’s close. Not much to worry about…until you remember that during that span the index traversed an 11% span. Along the way many of those moves were one day swings.
Index daily moves have been something to behold this year. Last Friday marked the 42nd time this year that the S&P 500 has dropped 1% or more. According to Bespoke Research, there have only been four other years that experienced this many or more big moves. So, if you are feeling a little off kilter by the constant moves back and forth, just know that markets are in rare territory for volatility.
Last week’s rally should not fuel thoughts of a rally revival. Yes, there were some significant moves last week and breadth improvements. One week does not a trend change make and there is a lot of ground to plow. We are a good 5% below the S&P 500’s 200-day moving average. The wall of worry to scale that 5% seems to grow daily. Last week could be a head fake for short-term traders.
Down is down
Usually volatility means either bad news, uncertainty or both. We would put the passing of Queen Elizabeth II on the bad news list. She was a global treasure. Uncertainty does reign across most markets, both stock and bonds.
What about commodities? As slowdowns take hold around the globe, demand for raw materials, transportation and finished goods continues to ebb. Copper, lumber, wheat, corn and crude oil remain well below recent highs. Some of the grain complex, notably corn futures, have risen the last five weeks. That is more speculators positioning ahead of today’s USDA corn crop estimate than a change in long- term trend. The Dow Transports index remains in a downtrend since its high last November. FedEx has led the group lower, falling -12%, followed by Alaska Air at -11.7% over that period. Raw materials and transportation stocks are a bellwether for corporate activity. Lower prices for both suggest recent GDP estimates of 2% for the U.S. third quarter may be too high.
Less up
One market that is trending higher is long-term interest rates. Treasury interest rates from 10 years through 30 years are near or above pre-shutdown levels. Traders are taking Fed speakers seriously after a number of speeches last week. Fed Governor Waller and St. Louis Fed President Bullard both favored a three-quarters of a point increase at the September 21 meeting. Chairman Powell stuck to the “data dependent” line, saying he could go either a half or three-quarters of a point.
One of the key data points is tomorrow’s consumer price index reading for August. Its year-over-year change peaked at 9.1% in June. July’s reading ticked down to 8.5% and economists estimate August is at 8%. These “headline” inflation numbers are dominated by gasoline prices. Key to remember is that even as the price of gas has fallen, volumes are also falling. People are not driving as much over the last three months in response to higher prices and cloudy economic outlook.
Even if CPI inflation month-over-month turns to zero for September through December, year-over-year inflation will still average 6.5%. Hardly a “neutral” level when overnight rates could end the year at 4%. Remember, CPI and PPI measure the rate of change of prices. Just because the rate falls to zero or negative does not mean we will return to 2019 prices. After four decades of successively lower inflation, we are not fans of the current environment.
We are grateful that we are not in Europe. Natural gas is three times higher than in March in the Netherlands. Germany’s producer price index hovers at 37% year-over-year. Their source of inflation is in part their reliance on natural gas from Russia. The Europeans have given the throttle of their economy to Putin — he can boost activity by allowing more gas to flow through Nord Stream 1 or cause plants to shut down as was the case last week.
Wrap-up
The last three days and this morning’s tape have more of a short squeeze feel than a true trend change. A rally is always welcome, but for the moment stocks and bonds are playing a (Fed) waiting game. Traders’ option positions are close to forcing dealers to buy stocks, which could push the rally towards 4,200.
The only green indicator we have for stocks now is investor sentiment. Sentiment is a very fast indicator, and we can afford to be patient. There are a few reds, but the majority is cautious yellow.
Essential Economics
— Mark Frears
Anticipation
Every fall, we have the preseason college football rankings, based on, well, no one is sure what. We know that last year’s finish, player and coach changes, and pedigree all come into play, but are they worth anything? Based on last weekend’s games, nope. Our expectations are not necessarily grounded in reality, and that makes things very interesting.
Markets
Where do we look in the “markets” for expectations about inflation? A very robust, liquid exchange is found in U.S. Treasury trading. One place to look for insight is the breakeven inflation rates for various terms. This is calculated by subtracting the real yield of the Treasury Inflation Protected Securities (TIPS) maturity from the closest term in the “normal” U.S. Treasury (UST) curve. The difference is the implied inflation rate for the particular term.
For example, the two-year implied inflation rate is calculated by taking the two-year TIPS security rate and subtracting the two-year UST rate. If you look at the chart below, you can see this rate peaked in March of 2022, and has been declining since then. This has fallen from a peak of 4.93% to the current 2.27%.
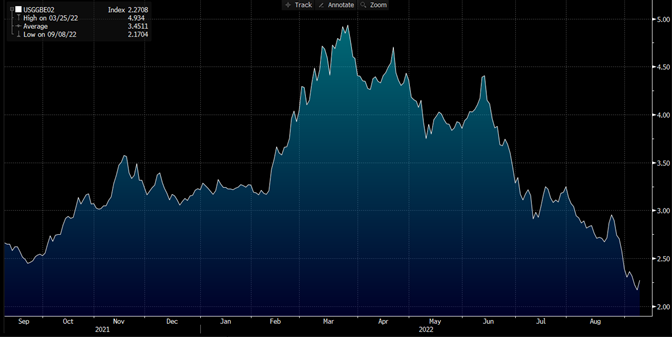
This is telling us that inflation will average 2.27% over the next two years. Given that it is currently somewhere around 6 – 8%, depending on the measure, markets expect that we have seen the worst.
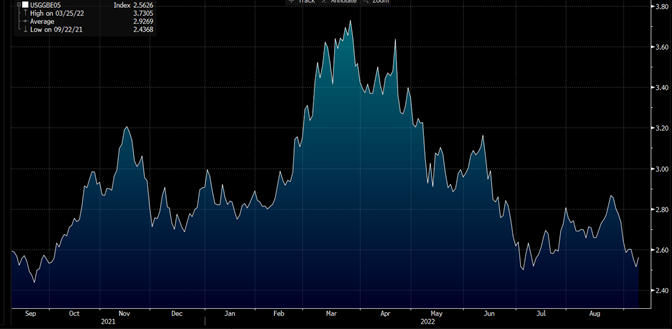
If you think this is an isolated short-term phenomenon, let us look further out the curve. The five-year breakeven curve is below. It also peaked in March of 2022 and has fallen since. The current five-year expected inflation rate is 2.56%.
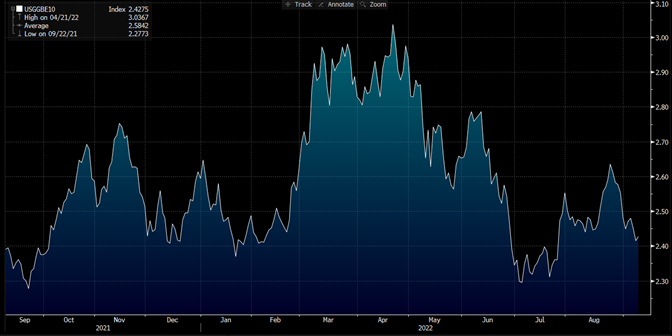
Looking even further out the curve, the ten-year rate has followed the same trend, falling to an expected 2.43%.
FOMC
The Fed has been overly emphasizing their willingness to fight inflation and the Fed Fund (FF) Futures market has taken this into consideration. They currently reflect FF climbing to 4% from the current 2.50% by March of 2023, an increase of 1.50%!
Based on the market’s view of inflation that we have seen in the charts above, this will have the desired effect of quelching price pressures. Do you think so?
Another perspective that the Fed has to keep in mind is that if they raise rates too fast and too far, it will stall the economy. Many components of the economy, including labor, still seem to be running pretty well. But, since monetary policy impacts economic activity with a substantial lag, the real effects of the cumulative monetary tightening that has already entered the economy have not been felt in full. Hmm.
Wrap-Up
Football season is long, and many unforeseen things can happen. I am looking forward to some great games from individuals and teams. As far as the Fed’s playbook, it could still have an audible called if the economy does not live up to expectations.
| Upcoming Economic Releases: | Period | Expected | Previous | |
|---|---|---|---|---|
| 13-Sep | NFIB Small Business Optimism | Aug | 90.5 | 89.9 |
| 13-Sep | Consumer Price Index MoM | Aug | -0.1% | 0.0% |
| 13-Sep | CPI ex Food & Energy MoM | Aug | 0.3% | 0.3% |
| 13-Sep | Consumer Price Index YoY | Aug | 8.0% | 8.5% |
| 13-Sep | CPI ex Food & Energy YoY | Aug | 6.1% | 5.9% |
| 13-Sep | Real Avg Hourly Earnings YoY | Aug | N/A | -3.0% |
| 14-Sep | Producer Price Index MoM | Aug | -0.1% | -0.5% |
| 14-Sep | PPI ex Food & Energy MoM | Aug | 0.3% | 0.2% |
| 14-Sep | Producer Price Index YoY | Aug | 8.8% | 9.8% |
| 14-Sep | PPI ex Food & Energy YoY | Aug | 7.1% | 7.6% |
| 15-Sep | Initial Jobless Claims | 10-Sep | 226,000 | 220,000 |
| 15-Sep | Continuing Claims | 3-Sep | 1,477,000 | 1,473,000 |
| 15-Sep | Retail Sales MoM | Aug | 0.0% | 0.0% |
| 15-Sep | Retail Sales ex Autos MoM | Aug | 0.0% | 0.4% |
| 15-Sep | Import Price Index MoM | Aug | -1.2% | -1.4% |
| 15-Sep | Export Price Index MoM | Aug | -1.1% | -3.3% |
| 15-Sep | Industrial Production MoM | Aug | 0.1% | 0.6% |
| 15-Sep | Capacity Utilization | Aug | 80.3% | 80.3% |
| 15-Sep | Business Inventories | Jul | 0.6% | 1.4% |
| 16-Sep | UM (Go MSU) Consumer Sentiment | Sep | 60.0 | 58.2 |
| 16-Sep | UM (Go MSU) Current Conditions | Sep | 60.2 | 58.6 |
| 16-Sep | UM (Go MSU) Expectations | Sep | 59.0 | 58.0 |
| 16-Sep | UM (Go MSU) 1-yr inflation | Sep | 4.6% | 4.8% |
| 16-Sep | UM (Go MSU) 5- to 10-yr inflation | Sep | 2.9% | 2.9% |
Steve Orr is the Executive Vice President and Chief Investment Officer for Texas Capital Bank Private Wealth Advisors. Steve has earned the right to use the Chartered Financial Analyst and Chartered Market Technician designations. He holds a Bachelor of Arts in Economics from The University of Texas at Austin, a Master of Business Administration in Finance from Texas State University, and a Juris Doctor in Securities from St. Mary’s University School of Law. Follow him on Twitter here.
Mark Frears is an Investment Advisor at Texas Capital Bank Private Wealth Advisors. He holds a Bachelor of Science from The University of Washington, and an MBA from University of Texas – Dallas.
The contents of this article are subject to the terms and conditions available here.