Nice November, but is the rally for real? — Week of November 28, 2022
Strategy and Positioning written by Steve Orr, Chief Investment Officer; and Essential Economics written by Mark Frears, Investment Advisor
| index | wtd | ytd | 1-year | 3-year | 5-year | index level |
|---|---|---|---|---|---|---|
| S&P 500 Index | 1.56 | -14.30 | -13.01 | 10.40 | 11.04 | 4,026.12 |
| Dow Jones Industrial Average | 1.80 | -3.70 | -2.08 | 9.13 | 10.20 | 34,347.03 |
| Russell 2000 Small Cap | 1.07 | -15.75 | -18.75 | 6.08 | 5.56 | 1,869.19 |
| NASDAQ Composite | 0.73 | -27.68 | -28.55 | 10.01 | 11.29 | 11,226.36 |
| MSCI Europe, Australasia & Far East | 2.16 | -13.17 | -11.94 | 2.72 | 2.60 | 1,962.94 |
| MSCI Emerging Markets | -0.09 | -21.33 | -22.47 | -0.87 | -1.31 | 941.01 |
| Barclays U.S. Aggregate Bond Index | 1.05 | -12.78 | -12.19 | -2.69 | 0.10 | 2,054.04 |
| Merrill Lynch Intermediate Municipal | 0.38 | -7.62 | -7.25 | -0.59 | 1.29 | 295.71 |
As of market close November 25, 2022. Returns in percent.
Strategy & Positioning
— Steve Orr
Better, but
Low holiday volume did not dampen traders’ moods last week. Another one to two percent gain for stocks put this month’s returns well above typical Novembers. November usually ranks second in annual performance for U.S. stocks. For 2022, this month’s 4.1% return for the S&P 500 through last Friday ranks third. Best months this year: July’s 9% gain and October’s 7.9%. As in October, much of the fundamental narrative for the recent rally centers around how much farther the Fed must go.
Technically the last six weeks of positive price action were pushed by lots of cash coming into markets. Commodity trading advisors and risk parity funds had plenty of cash to work with. Market liquidity and, to a degree, market performance tend to follow flows in and out of the U.S. Treasury General Account. The TGA fell the last several weeks, meaning money was running from Treasury borrowing into the banking system.
Not yet
Rallies build from market bottoms. That sounds rather “duh” on its face but let’s pause for a moment. Here is the S&P 500 over the last several months. Looks like a market stuck in the middle, correct? Recent price action is contained with the August high and October low.
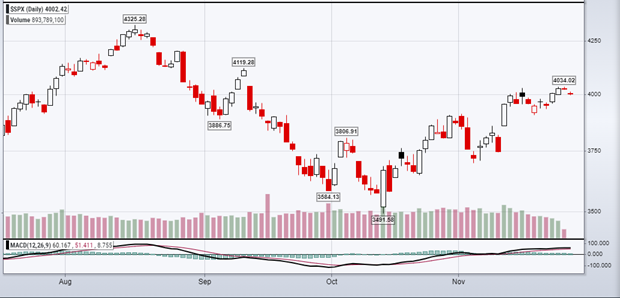
Source: stockcharts.com
That is the short-term trend. In the very short-term, or TV News Cycle, stocks have rallied nicely the last two weeks. Stepping back a bit, the red line shows that the intermediate term trend is still down.
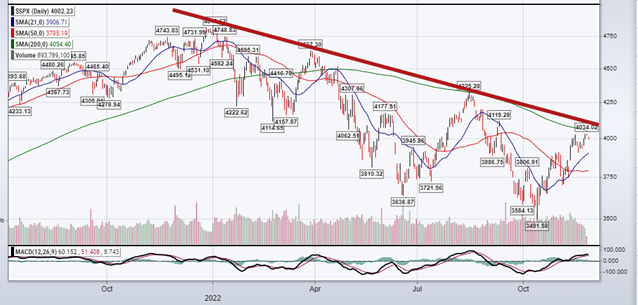
Source: stockcharts.com
Both charts show the recent S&P 500 low occurred on October 13. That day the index rallied 2.6% on the heels of a vvvvverry slightly improved consumer price index report. The 5.5% run on November 10 followed the same CPI script. CPI days have been market movers for most of this year, and we do not expect that to change in the coming months.
Was October 13 the low for this Bear cycle? We would be tempted to say “yes” if the Most Anticipated Recession Ever turns out to be rolling along right now and very mild. What do we look for in a stock market bottom? Individual stocks should be making new 52-week lows, markets around the globe should be making new lows, volatility should be high and rising, and very few stocks should be above their moving averages.
Running down that checklist, one-third of global stocks were making new lows in September. Since then, less than one percent is making new lows. None of the 47 major stock markets around the globe are making new lows — none. Usually, bottoms of Bear cycles occur when over half of the 47 are making new lows. Volatility, as measured by the implied volatility of nearby S&P options, should be above 45 and rising. VIX is around 20 today and falling. Finally, the percentage of stocks trading above their 200-day moving average should be below 50, or 10% of the S&P 500. Today over half are above their 200-day moving average.
A couple of Bottom Boxes got checked in late September, but we have not yet satisfied the usual checklist for a bottom of this Bear cycle. Markets do not have to put in a bottom to rally, but the strongest and longest rallies come after bottoms.
Fed Ahead
In addition to no bottom signals, look at the economy through the Fed’s eyes. They have repeatedly said they will lower the level of rate increases. That is why traders are betting on only a one-half percent increase at the December 14 Fed meeting. Recall the last four meetings have produced three-quarter percent increases. Markets interpret a step down in increases as “the beginning of the end” of rate increases. Not so fast. In the same breath, Fed officials have been clear that they have a long way to go in battling inflation and can keep rates higher for longer.
The Fed sees fourth quarter GDP posting a positive number — somewhere between 1.5% and 3%. The Atlanta Fed model estimate sits at an unrealistic 4.3%. That would be great but does not fit any of the recent data. Five regional Fed banks survey manufacturing and services. All are lower month-over-month. The Dallas Fed’s manufacturing survey has fallen for seven months in a row. New orders fell in the November survey period at the fastest rate since May of 2020. General business activity and management outlook also continue to slide lower. Layoff announcements, especially in tech, are increasing but have yet to impact the weekly jobless claims.
The Fed sees stocks above 4,000 (S&P 500), jobless claims well below 300,000 per week, and positive GDP growth. In their eyes they have not done enough to throttle back the economy and cut the number of job openings. They believe that is the mechanism by which they will tame price inflation. We will see. Headline inflation is already coming down, thanks to fuel and raw materials prices. Over the next six months, lower rent and housing prices will begin to pull inflation lower. The next CPI release is on December 13, the day before the Fed press release and Chair Powell’s press conference. If the CPI number still starts with seven percent, expect Powell to be hawkish in his comments and try to talk stocks down.
Wrap-up
An Anonymous thinker once wrote that “the stock market is that creation of man which humbles him the most.” Markets do not have to obey a Bottom Checklist in order to rally. Historically, the largest rallies come after mid-terms. More, please.
Steve Orr is the Executive Vice President and Chief Investment Officer for Texas Capital Bank Private Wealth Advisors. Steve has earned the right to use the Chartered Financial Analyst and Chartered Market Technician designations. He holds a Bachelor of Arts in Economics from The University of Texas at Austin, a Master of Business Administration in Finance from Texas State University, and a Juris Doctor in Securities from St. Mary’s University School of Law. Follow him on Twitter here.
Mark Frears is an Investment Advisor, Executive Vice President, at Texas Capital Bank Private Wealth Advisors. He holds a Bachelor of Science from The University of Washington, and an MBA from University of Texas – Dallas.
The contents of this article are subject to the terms and conditions available here.