Lousy first half, let's get 2022 over with — Week of July 4, 2022
Strategy and Positioning written by Steve Orr, Chief Investment Officer; and Essential Economics written by Mark Frears, Investment Advisor
| index | wtd | ytd | 1-year | 3-year | 5-year | index level |
|---|---|---|---|---|---|---|
| S&P 500 Index | -2.18 | -19.12 | -10.17 | 10.58 | 11.51 | 3,825.33 |
| Dow Jones Industrial Average | -1.27 | -13.54 | -8.46 | 7.36 | 10.20 | 31,097.26 |
| Russell 2000 Small Cap | -2.09 | -22.55 | -24.98 | 4.71 | 5.38 | 1,727.76 |
| NASDAQ Composite | -4.12 | -28.58 | -22.80 | 12.10 | 13.70 | 11,127.84 |
| MSCI Europe, Australasia & Far East | -2.18 | -19.83 | -18.04 | 1.12 | 2.63 | 1,846.28 |
| MSCI Emerging Markets | -1.57 | -18.21 | -25.32 | 0.29 | 2.35 | 1,000.67 |
| Barclays U.S. Aggregate Bond Index | 1.27 | -9.81 | -9.71 | -0.79 | 1.00 | 2,111.40 |
| Merrill Lynch Intermediate Municipal | 0.32 | -7.65 | -7.43 | -0.10 | 1.43 | 295.61 |
As of market close July 1, 2022. Returns in percent.
Strategy & Positioning
— Steve Orr
Third place
Everyone wants to win the investment game. In theory, it's relatively simple. Company earnings are a large part of the economy. As earnings grow, so goes the economy. When inflation is low, borrowers can pay back loans at interest rates that encourage lenders to lend more. Stocks and bonds — paper assets that are claims on earnings and interest — grow over the long term at about the rate of the economy. Careful planning and following a process can boost returns above that long-term trend.
The hard part is building a repeatable process and sticking to it through the tough times. Thankfully Bear cycles rarely last as long as Bull cycles. At the midpoint of the year, we are at the edge of a Bear cycle. Stocks spent the first half of this year jumping their way down to the “rule of thumb” 20% decline for a Bear cycle. Nearly 90% of the trading days in the first six months of 2022 saw the S&P 500 move one percent or more. The last time the S&P had that level of volatility? The 2008 and 2002 Bear markets.
Don't fight
Let’s get the records out of the way so we can focus on the future. The S&P 500’s 20% drop in the first half of 2022 is the third-worst start in the index’s 65-year history. It is the worst start for the NASDAQ and Russell 2000 small cap indices. The Bloomberg Barclays U.S. Aggregate bond index fell -10.1% through June 30th, its worst start in its history. Back-to-back negative quarters for stocks are not rare but are usually associated with recessions. Bonds losing double digits in any period is a rare event.
A long list of causes and events are driving the global slowdown. Despite the risk of missing something exciting, our portfolio process places the following at the top of the list: War and its effect on energy supplies, inflation, and the Fed — or WIF for short. Russia controls any additional natural gas supplies into Europe. Rising energy costs and the turn toward electric vehicles are cutting into German auto manufacturing, which is having ripple effects across their economy. Inflation around the globe is proving persistent and less related to supply chain effects than thought even two months ago. Rents, fuel and food costs suggest to us that inflation will be higher for longer. As in several years to approach the Fed’s 2% annual inflation target, instead of mid-2023.
Which leads us back to interest rate increases and the Fed. Japan and China’s central banks are easing lowering rates and injecting money into their moribund economies. Europe’s central bank may be waffling now that they see growth slowing. Here at home, Chairman Powell appears, for the moment, to believe that pain is necessary for the economy to bring down inflation. Will the Fed continue to raise rates long after the economy has turned lower? Given the Fed’s history of being late, we believe so. But in the words of the great Marty Zweig, “Don’t fight the Fed.”
Road ahead
As Mark notes, our economy downshifted a gear or two in the second quarter. Certainly, inflation is riding the brakes instead of the clutch.* July is typically a top three or better month for stock performance. The long-term average for July is above 1%. War, inflation and the Fed present substantial headwinds for reaching the “average July.”
The recent low for stocks was June 16th. On that date, the S&P 500 was down over 23% for the year. What has happened in the past when the big index is down that much? Out of seven cases, the S&P fell further in three of them. There are also eight cases where the S&P 500 fell at least 15% in one quarter. In seven of the eight cases, stocks were higher at the end of the next quarter (our 3rd). In all cases in the next six- and 12-month periods stocks were higher. Our indicators suggest the current Bear cycle is not yet over. If June 16th was the low, that does not mean markets would spring back to recent highs. WIF represents strong headwinds that will keep our indicators moving toward further risk reduction.
Wrap-up
Short and intermediate term trends are still down. Sharp rallies occur in these times and can fool traders who do not stick to their process. This is a summer of patience. Our indicators are keeping us on the sidelines and telling us to lower risk in the coming weeks.
<em>*Clutch: automotive part familiar to Boomers</em>
Essential Economics
— Mark Frears
Summer
What are your plans for the hot, vacation-time of the year? In Texas, we are often looking for ways to escape the heat and it has come early this year. Have you changed plans this year, with higher costs and disrupted air travel stories? Varying demographics will play out in whether behavior changes for summer plans. We will head to Canada at some point for some relief. Water temps will be cold, especially compared to bathwater temps in Texas!
Temperature readings
Last week the thermometer was all over the place as far as economic releases. We started off with Durable Goods and they came in higher than expected. The precursor for future activity, Capital Goods Orders Non-Defense Ex-Aircraft, came in at 0.5% for May, above the prior reading of 0.4% and better than the 0.2% expected.
Pending Home Sales were expected to drop 4% yet came in with a 0.7% increase. People are still out there buying/selling homes during this normally active time of the year. The Conference Board’s Consumer Confidence release for June also downshifted. This indicator has been holding up lately as it is more focused on employment, but the overall, present situation and expectations components were all lower than last month by (un)healthy margins.
Next, we had the third revision to Q1 Gross Domestic Product (GDP), and it was down slightly to -1.6%. The biggest surprise here was the downward revision to Personal Consumption to 1.8%, down from 3.1%. Initially this had been an acceleration of demand in Q1 after slower Q3 and Q4 of 2021. Along with an increase in inventories, this is a cooler reading.
As you and I are two-thirds of GDP, it matters very much how much we are earning and spending. Personal Income was about flat from last month and right at expectations. Personal Spending was lower than expected and down from the prior month. Wages are hanging in there, but the inflation/recession concern is starting to change spending behaviors. Jobless Claims continue to trend higher, foretelling a slowing job market.
While manufacturing is not as significant a part of our economy nowadays, it is still a much-watched indicator for economic activity. The ISM Manufacturing Purchasing Managers Index (PMI) for June came in 1.9 points below expectations and 3.1 points below last month. Any reading above 50 in this diffusion index indicates expansion, and readings below reflect slowing/contracting economic activity. While the overall reading is above 50, the New Orders and Employment numbers have fallen below 50. The Prices component did come down in June, but the other metrics further the economic slowing view.
Powell and his crew
The Federal Open Market Committee (FOMC) has one primary tool, overnight Fed Funds (FF) target rate, to accomplish their goals of full employment and stable inflation. Some would argue that their communication is a much stronger influence in this battle. As we discussed last week, markets are starting to look past inflation to a potential recession, if the Fed pushes short-term rates too high and demand is quashed. A primary way the FOMC tracks inflation is the Personal Consumption Expenditures (PCE) Core Deflator. In May, this came down to 4.7%, from prior month’s 4.9%. Deceleration is a positive here.
Current FF rate is 1.50–1.75% and the next FOMC meeting is July 27. Futures are pricing in a 75-basis point (bp) increase for this meeting and 50bp more for the September 21 meeting. Projections for December 2022 show a rate of close to 3.25%, indicating one more 25bp move in November or December. The terminal rate, where direction reverses, is now at 3.42% in March 2023. This is a significant change in magnitude and timing. As of June 10, the peak was 3.65% in August 2023. Markets expect the FOMC to be done earlier, at a lower level. Inflation has been conquered!
Go, slow, or stop
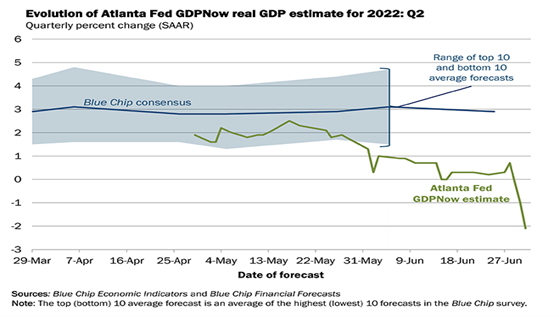
The definition of a recession is two consecutive quarters of negative GDP growth. We know that Q1 was -1.6% and it now appears Q2 will be negative. The Atlanta Fed publishes a real-time estimate of GDP and as of July 1, we are looking at -2.1%.
Do you think we are in a recession? Has the FOMC reached its goal of demand destruction? As you may recall, they do not influence supply, so must rely on slowing demand. We are seeing price metrics slowing, and evidence of slowing in the economy. The Conference Board Leading Economic Index is at all-time highs, but starting to slow, indicating coming recession.
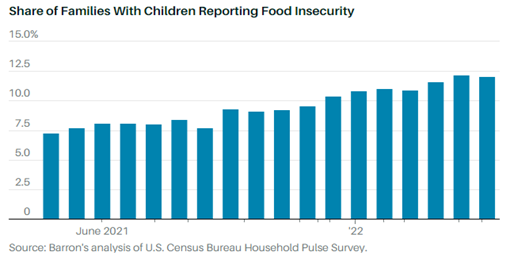
While higher income families, in general, were able to improve their balance sheets during the pandemic, lower income families have seen higher wages recently. Unfortunately, higher wages are not keeping up with higher prices, as can be seen below.
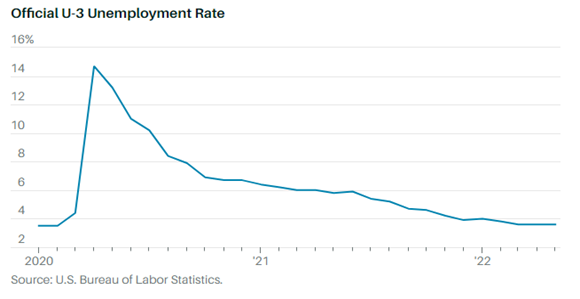
At the same time, even with slightly rising Jobless Claims, the unemployment rate continues at a low level.
The goal of the FOMC is a “soft landing” which could show up as a minor recession. The timing of slowing demand, considering still high prices will tell the tale of how much pain we will see.
Wrap-up
Overall, the temperature of the economy is unsettled. While there are still bright spots in the financial health of the U.S., the consumer is being bombarded with higher costs, negative media and uncertainty. Will they pull back, wait for sunny days and ride this out? Most likely.
| Upcoming Economic Releases: | Period | Expected | Previous | |
|---|---|---|---|---|
| 5-Jul | Factory Orders | May | 0.5% | 0.3% |
| 6-Jul | S&P Global US Services PMI | Jun | 51.6 | 51.6 |
| 6-Jul | S&P Global US Composite PMI | Jun | 51.2 | 51.2 |
| 6-Jul | ISM Services Index | Jun | 54.0 | 55.9 |
| 6-Jul | JOLTS Job Openings | May | 11,000,000 | 11,400,000 |
| 6-Jul | FOMC Minutes released from June 14-15 meeting | |||
| 7-Jul | Initial Jobless Claims | 2-Jul | 230,000 | 231,000 |
| 7-Jul | Continuing Claims | 25-Jun | 1,330,000 | 1,328,000 |
| 8-Jul | Change in Nonfarm Payrolls | Jun | 273,000 | 390,000 |
| 8-Jul | Change in Private Payrolls | Jun | 240,000 | 333,000 |
| 8-Jul | Unemployment Rate | Jun | 3.6% | 3.6% |
| 8-Jul | Average Hourly Earnings MoM | Jun | 0.3% | 0.3% |
| 8-Jul | Labor Force Participation Rate | Jun | 62.4% | 62.3% |
| 8-Jul | Underemployment Rate | Jun | N/A | 7.1% |
| 8-Jul | Consumer Credit | May | $30.000B | $38.069B |
Steve Orr is the Executive Vice President and Chief Investment Officer for Texas Capital Bank Private Wealth Advisors. Steve has earned the right to use the Chartered Financial Analyst and Chartered Market Technician designations. He holds a Bachelor of Arts in Economics from The University of Texas at Austin, a Master of Business Administration in Finance from Texas State University, and a Juris Doctor in Securities from St. Mary’s University School of Law. Follow him on Twitter here.
Mark Frears is an Investment Advisor at Texas Capital Bank Private Wealth Advisors. He holds a Bachelor of Science from The University of Washington, and an MBA from University of Texas – Dallas.
The contents of this article are subject to the terms and conditions available here.