Job growth continues to impress; no recession this year — Week of April 4, 2022

Strategy and Positioning written by Steve Orr, Chief Investment Officer; and Essential Economics written by Mark Frears, Investment Advisor
| index | wtd | ytd | 1-year | 3-year | 5-year | index level |
|---|---|---|---|---|---|---|
| S&P 500 Index | 0.08 | -4.28 | 14.66 | 18.58 | 16.04 | 4,545.86 |
| Dow Jones Industrial Average | -0.12 | -3.72 | 6.98 | 12.36 | 13.47 | 34,818.27 |
| Russell 2000 Small Cap | 0.68 | -6.59 | -6.27 | 11.76 | 9.93 | 2,091.11 |
| NASDAQ Composite | 0.66 | -8.68 | 6.53 | 23.12 | 20.41 | 14,261.50 |
| MSCI Europe, Australasia & Far East | 1.28 | -5.77 | 1.17 | 7.98 | 7.30 | 2,181.63 |
| MSCI Emerging Markets | 1.53 | -6.99 | -12.39 | 4.84 | 6.32 | 1,141.79 |
| Barclays U.S. Aggregate Bond Index | 1.02 | -5.93 | -4.47 | 1.79 | 2.14 | 2,215.38 |
| Merrill Lynch Intermediate Municipal | 0.05 | -5.87 | -4.59 | 1.30 | 2.20 | 301.31 |
As of market close April 1, 2022. Returns in percent.
Strategy & Positioning
— Steve Orr
- First quarter challenging for all markets
- Bond prices hit thanks to inflation & Fed, but interest and principal repayment not an issue
- Job growth impressive; we are back to full employment
- Wednesday’s Fed minutes may give details on balance sheet reduction
One Down
Well, what else can a quarter throw at us? If it is excitement you are looking for, be mindful of your wishes. A brief recap of the first quarter: more pandemic, double-digit inflation, earthquake stopping chip production, droughts, global fertilizer supplies cut at least in half, central banks raising interest rates and, oh, by the way, a ground war in Europe.
Where should stocks be in the face of rates rising back to pre-pandemic levels and uncertain economic growth? Below 2019? Perhaps a recession level P/E of 13x times? That would place the S&P 500 around 3,100. How about a quick 13% drop for most of the indices and nice recovery to just down 5%? That bounce in March values the S&P 500 at 19.6 times forward earnings, a reasonable level at these interest rates. Despite mid-term election year volatility, the first quarter’s 5% drop shows remarkable strength in the face of the liability list above.
The quarter’s greatest damage was reserved for the bond markets. Remember the Fed ran short-term rates from 2.25% to zero at the start of the pandemic. The economy’s rapid recovery gave the Fed room to return to pre-pandemic rate levels at least a year ago. What difference does a year make? How about double-digit inflation thanks to pandemic money printing from Congress. Inflation’s takeoff point (that’s inflection for the stat geeks) was March a year ago. That month Congress sent $1.9 trillion to individuals and states. This brought the total pandemic spending from Congress to roughly $4 trillion, or 20% of the size of our economy. All those extra dollars floating around combined with supply chain inflation are pushing prices 10% or more above year ago levels. The Fed is now well beyond its goal of “inflation averaging 2%” and has a tough road ahead to tame inflation.
The bond market is trying to figure out how far and how fast the Fed is going to react to persistent inflation. That uncertainty pushes prices lower. Last month, the Fed kicked off a new tightening cycle by raising interest rates by one quarter of a percent. Futures markets are forecasting high odds of a half percent increase at the May and June Fed meetings. Yields rose throughout the quarter, pausing only briefly at the start of the Russian invasion. As with most tightening cycles, the 2-year Treasury note experienced the most pain. It rose 1.7% to end the quarter at 2.48% and their prices fell nearly 3%. In contrast, 10- and 30-year Treasuries rose only 0.9% and 0.58%, respectively. Longer maturities may not move as far in these cycles, but their prices do move much further. Long Treasury prices fell between 11% and 14% during the quarter. These declines mark one of the worst quarters since bond indices were created in the early 1970s.
Wall Street knew that the Fed would some day pull rates higher as the pandemic wound down. Why the ugly price reaction in high quality bonds? Several factors are playing a part. We mentioned the 20% jump in money supply and the inflationary shock. The Fed now plays a supply role also. It owns nearly 25% of the Treasury market, which depresses liquidity and can make certain maturities harder to trade. Tough trading means levels move farther than they should. The war, virus variants and China real estate are also playing a part. None of these temporary price reactions affect the interest and eventual repayment of principal at par however.
This morning, two- and three-year maturities are slightly higher in yield than 10- and 30-year maturities. At these very-low interest rates the yield curve is telling us that the Fed cannot raise rates too far without meaningfully slowing economic growth. We think the year ends with short-term rates around 2% and no recession.
Essential Economics
— Mark Frears
Foundations
Many homes in Texas are built on a slab foundation, with no crawl space or basement. As the soil under and around the house can dry out in the summer heat, it is necessary to keep dirt around the slab watered. I thought you were just supposed to water your grass and shrubs. Well, you must also water your foundation. If you don’t, you will see cracks in your interior and exterior walls and doors that don’t close. We are not seeing cracks in the walls or foundation of the economy, as it continues to perform well.
Off to Work I Go
One area of the economy that is doing well and improving is the employment sector. First, we have seen 11 consecutive months of 400,000 plus jobs added to the workforce. This is the longest trend since 1939. Leisure and hospitality continue to improve and labor force participation is above pre-pandemic levels except for the 55-year-old-and-up category. Average hourly earnings continue to stay higher with five of the last six months showing year-over-year growth above 5%. In addition, the prime-age employment-to-population ratio is at 80%, just 0.05% below pre-Covid levels, and, given the current momentum, should surpass that in the next couple of months.
Second, jobless claims have settled in at around 200,000 a week, even touching a 52-year low a few weeks ago. This is telling you employers are holding onto workers even in a high demand environment. This metric can be a leading indicator, but we would have to see claims above 300,000 consistently to bring on recession fears.
Third, while we are fast approaching full employment, there are still jobs available. The Job Openings and Labor Turnover Survey still shows over 11 million openings with the quit rate slowing.
Employers
At the office, more people are going back to work, and it will be interesting to see how productivity trends as we leave our home offices. There is also the intangible benefit of working around your colleagues toward a common goal.
The Institute of Supply Management (ISM) manufacturing report for March showed some very positive trends. First, employment was up to 56.3 from 52.9, a 6% increase. Second, backlog of orders has been above 60 for the last few months, showing there is demand for product, and the firms have room to grow. Third, customer inventory has been below 40 for quite some time, showing the buyer has room to buy more product. The Texas Manufacturing General Business Activity Index did fall in March but is still in growth territory.
The Leading Economic Index yearly change tends to drop to zero or below, prior to the last seven recessions. It is currently at 7.6%, well above zero.
Due to rising mortgage rates, there is concern that the important housing sector will take a hit. While we have seen existing home sales slow, building permits, housing starts, and better availability of labor are contributing to a positive trend here. Rates are still at historic lows and the multifamily tract is doing well. Supply is still not keeping up with demand in this critical area. Good for builders, not so much if you are looking to buy.
Costs Are Rising
As you can see below, the cost of buying necessities is starting to weigh on consumers.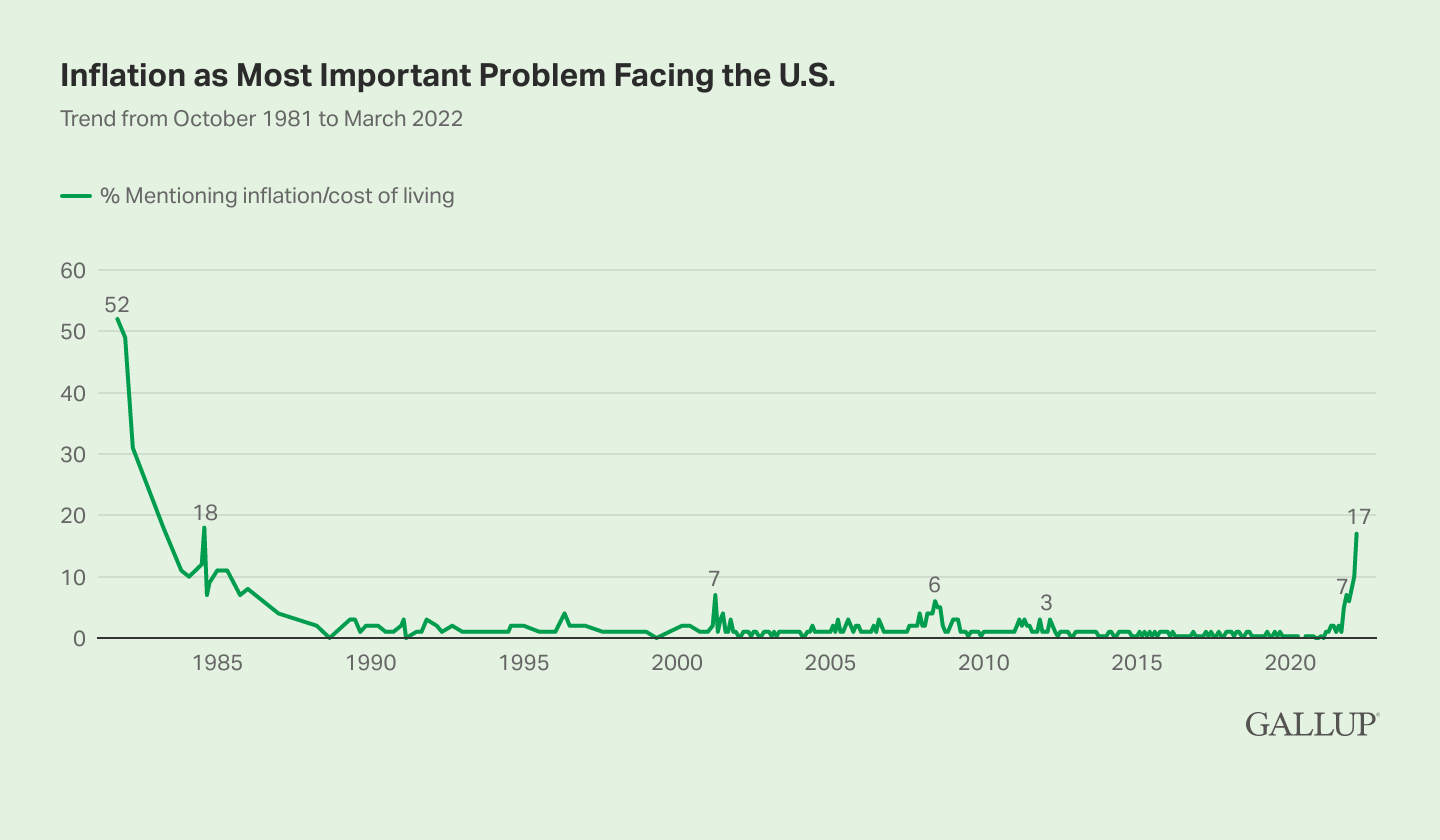
If you have been to the grocery store, or filled up your vehicle with gas lately, this rings true for you. While we have seen wages rise, inflation is rising faster, causing real wages (actual less inflation) to be negative. At some point this will crimp the budgets of consumers, causing them to pull back in some areas. This is the thin line between “good” inflation helping with growing wages and business, versus “bad” inflation that we can’t keep up with.
We got Q4 Gross Domestic Product (GDP) final numbers last week, and while the overall number looks good at 7.1%, the GDP Price Index was 7.2%. In “real” terms, GDP was negative. As we look at Q1GDP, the Russian invasion of Ukraine caused some slowdown in the economy, even as Covid restrictions continue to be lifted. The Atlanta Fed GDPNow projection shows Q1 at 1.5%, as of April 1, 2022.
While inflation is an issue, we still believe it will decline later this year, due to improved supply chain conditions and increasing sources of oil and natural gas. Some commentaries are harkening to compare this to the 1970s, when we had a sustained period of higher costs. There are material differences between the two times. First, we are not in a time of rapidly growing population; in fact, we are close to declining in total numbers. Second, the economy is growing slower now, not fueling as much inflation. Third, income is growing slower today. Fourth, productivity is much stronger today.
Wrap-Up
The economy is still doing very well, thank you. The FOMC is now in inflation-fighting mode. They will have less concern about choking off growth if we continue to see good numbers. I am a buyer of soaker hoses as they provide a slow, steady supply of water to the foundation around my house.
The inflation numbers put the Fed fear in traders in the first quarter. We think most of the damage in bond-land has been done. Earnings estimates continue to look good. We expect the bumpy ride to continue into the second quarter but are glad the first quarter is over.
| Upcoming Economic Releases: | Period | Expected | Previous | |
|---|---|---|---|---|
| 4-Apr | Factory Orders | Feb | -0.6% | 1.4% |
| 4-Apr | Factory Orders ex Trans | Feb | 0.3% | 1.0% |
| 5-Apr | Trade Balance | Feb | -$88.6B | -$89.7B |
| 5-Apr | S&P Global US Services PMI | Mar | 58.9 | 58.9 |
| 5-Apr | S&P Global US Composite PMI | Mar | 58.5 | 58.5 |
| 5-Apr | ISM Services Index | Mar | 58.4 | 56.5 |
| 6-Apr | FOMC Meeting Minutes released from March 16 @1:30p CDT | |||
| 7-Apr | Initial Jobless Claims | 2-Apr | 201,000 | 202,000 |
| 7-Apr | Continuing Claims | 26-Mar | 1,301,000 | 1,307,000 |
| 8-Apr | Consumer Credit | Feb | $17.000B | $6.838B |
| 8-Apr | Wholesale Inventories | Feb | 2.1% | 2.1% |
Mark Frears is an Investment Advisor at Texas Capital Bank Private Wealth Advisors. He holds a Bachelor of Science from The University of Washington, and an MBA from University of Texas – Dallas.
Steve Orr is the Executive Vice President and Chief Investment Officer for Texas Capital Bank Private Wealth Advisors. Steve has earned the right to use the Chartered Financial Analyst and Chartered Market Technician designations. He holds a Bachelor of Arts in Economics from The University of Texas at Austin, a Master of Business Administration in Finance from Texas State University, and a Juris Doctor in Securities from St. Mary’s University School of Law. Follow him on Twitter here.
The contents of this article are subject to the terms and conditions available here.