Signposts on the way to a recession — Week of March 13, 2023

| index | wtd | ytd | 1-year | 3-year | 5-year | index level |
|---|---|---|---|---|---|---|
| S&P 500 Index | -4.51 | 0.91 | -7.81 | 12.02 | 8.61 | 3,861.59 |
| Dow Jones Industrial Average | -4.35 | -3.24 | -1.71 | 10.73 | 7.02 | 31,909.64 |
| Russell 2000 Small Cap | -8.02 | 0.89 | -10.60 | -10.83 | 3.42 | 1,772.70 |
| NASDAQ Composite | -4.68 | 6.63 | -14.38 | 11.02 | 9.07 | 11,138.89 |
| MSCI Europe, Australasia & Far East | -0.21 | 6.61 | 3.91 | 10.05 | 3.45 | 2,062.92 |
| MSCI Emerging Markets | -1.96 | 1.40 | -9.32 | 2.87 | -1.64 | 968.39 |
| Barclays U.S. Aggregate Bond Index | 0.01 | 0.29 | -8.42 | -4.03 | 0.53 | 2,054.63 |
| Merrill Lynch Intermediate Municipal | 0.35 | 0.57 | -2.15 | -1.07 | 1.82 | 300.51 |
As of market close March 10, 2023. Returns in percent.
Investment Insights
— Steve Orr
Events
What is “normal” in today’s terms? Most market participants remember the 2008-09 great financial crisis, or “GFC” for short. That once-in-a-century event gave birth to “normal” central bank interference in markets, rate manipulation and ultra-low interest rates. The cause of the GFC earlier in the decade can be laid at the feet of Congress, but that is a story for another time. The key for what is “normal” now is the events leading up to the GFC and most recessions.
We usually think of events as outside shocks to markets that last a relatively short time. Small wars, blockage of the Suez Canal, for example. They may wobble markets briefly but do not change the intermediate and long-term trends in the market. Other events pop up and consume the news for a few days or weeks and then fade away. Do these affect markets? Most certainly. In proper context, they serve as signposts for trend changes.
Signposts
Economic data comes in two forms: hard and soft. “Hard” data is calculated from activity, such as money supply changes, employment and barrels of oil exported. “Soft” data is surveys and estimates inferred from interviews. Examples include the regional Federal Reserve surveys of businesses and monthly purchasing manager indices. Hard data is what happened last month or last quarter. Soft is what people are thinking or planning on doing in the coming months. Both serve as canaries in the economic coal mine, giving clues as to what may happen next.
The yield curve, a list of U.S. Treasury interest rates from three months to 30 years, has an impressive track record of anticipating recessions. Perfect in every respect? No, but when certain short-term rates jump above longer-term rates, a recession has followed every time since World War II. Short rates higher than long rates are called an inverted yield curve. Here is today’s curve (top solid line) versus a “normal” positively sloped curve five years ago:
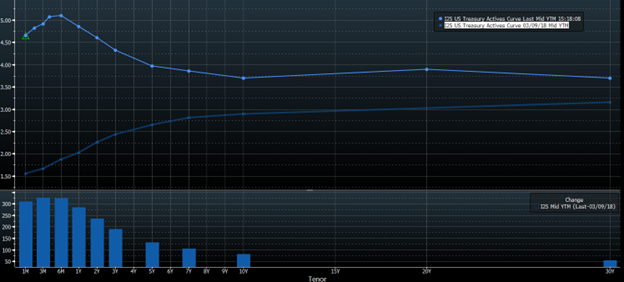
The short-term maturities have jumped over 3% higher, anticipating more rate increases from the Federal Reserve. Long maturities at the far right have barely budged. When three-month Treasury Bill rates rise above the 10-year Treasury Note, a recession follows about one year later. Late Friday, the three-month Bill traded hands at a 4.89% interest rate, and the 10-year Treasury at 3.7%, for an inversion of 1.19% or 119 basis points in bond lingo. The spread went inverted in early November, implying a recession this coming fall.
Hard data in other areas of the economy points to slowing future earnings and activity, specifically new orders and capital expenditure plans by businesses. If a recession is in the cards, then all interest rates should fall toward that lighter blue line from 2018 in the above graph. One signpost we have watched warily the last three weeks was the spread between two- and 30-year Notes. The two-year Treasury is a handy guide for where the Fed is going with short-term interest rates. It moved smartly higher from the 4% area in early February to 5.07% last Wednesday. At the same time 30-years were drifting lower.
Traders were betting that the Fed would continue to raise rates and had gone too far. Why? Because falling long-term rates suggest lower GDP growth in the future. When both happen at the same time, the divergence suggests something is brewing.
Here’s your…
The Fed has raised rates from zero to a range of 4.5% to 4.75% at the fastest speed since the Volker-led Fed in the early ’80s. The signpost that it’s having an effect is the sheer volume of funds flying into overnight money funds and Treasury Bills. This money is leaving the banking system for 4% and higher rates. Your checking and savings accounts are liabilities for the bank. If the liabilities drop, then the bank must sell assets (bonds) to raise more cash. When rates rise, bonds are sold at a capital loss. Cash and bonds leaving the bank’s books means there are fewer assets available to make loans.
The “final straw” that starts most recessions is removal of credit from the economy. In other words, banks quit making loans. The starting point may be different before each recession, but when businesses can no longer finance trade receivables and working capital, activity drops, and job losses invariably follow.
Signs
Poster children for money leaving banks are the crypto meltdowns and Silicon Valley Bank. Last year’s delinking of Terra’s token from the value of the U.S. dollar cost investors $20.5 billion. Then came the collapse of 3AC / Celsius, which evaporated $33 billion. The estimates of FTX’s failure total around $9 billion, according to published estimates. Consensus thinking was these failures were confined to the crypto world. Silvergate was next on the list of troubled institutions. It was a “standard” bank but morphed into a crypto lender.
In retrospect, low interest rates fueled some of crypto’s growth. Stable coins and exchange lending could earn “interest” that was well above market rates a year ago. Now that is not the case. What other signs of a coming credit crunch should we be watching? Credit card usage is rising rapidly. Default rates could ramp higher. Subprime auto loans also go on the list.
Fast forward to last week when the FDIC arrived at Silvergate’s offices in La Jolla, California. They expected to work with the bank through its crypto and deposit troubles. The bank decided to shut down because most of its assets were tied up in crypto currencies and its crypto business clients wanted their crypto or money back. Silicon Valley Bank, a national lender specializing in venture capital and tech, followed in short order, closing its doors on Friday, then Signature Bank followed over the weekend. Three bank failures and in Silicon Valley’s case, the largest since 2008. Silicon Valley’s $209 billion in assets (as of 12/31) placed it about 16th in size in the U.S.
TLTF2
A handy phrase for Fed rate increase cycles is “Raise rates until something breaks.” Not very subtle but unfortunately accurate. Were the crypto and SVB failures enough of a sign that something is broken? Certainly, traders thought so, as last week traders piled into Treasury bonds, pushing their prices higher and yields lower. By late Friday the two-year Treasury yielded 4.08%, a full point below Wednesday’s 26-year high of 5.07%. Traders piling into U.S. Treasuries in a flight to quality is another signpost: they suggest traders are worried something else is brewing.
We have written repeatedly that the Fed is too late, goes too far and/or too fast (TLTF2) in its rate increases. Last week’s bank failures and last year’s crypto failures are certainly driven in part by investors moving to higher, safer returns as the Fed began raising rates. Chairman Powell was very clear in his Congressional testimony last week that rates can go higher and stay there longer. Markets are starting to get the message. Stocks trading at 18 times earnings will need to rethink what margins may be in the next several quarters. Clearly 12% gross margins for the S&P 500 are in the rearview mirror.
The Fed has already checked the “too late” and “too fast” box for this cycle. Can it afford to slow the rate of increases in the face of continued job growth? Inflation for February will likely print at 6% tomorrow morning. That will still be “high” for the Fed, and we should expect rate increases to continue for several more meetings.
Wrap-up
Payroll growth has beat analysts’ estimates for ten months straight. Jobs are one of the last pillars of the economy to turn lower. Rising jobless claims may be the signpost of lower job growth in coming months.
The normal effects of higher rates finally surfaced last week with the first major bank failure since 2008. Cash and short-term investments continue to play a role in our thinking. We remain cautious.
Steve Orr is the Executive Vice President and Chief Investment Officer for Texas Capital Bank Private Wealth Advisors. Steve has earned the right to use the Chartered Financial Analyst and Chartered Market Technician designations. He holds a Bachelor of Arts in Economics from The University of Texas at Austin, a Master of Business Administration in Finance from Texas State University, and a Juris Doctor in Securities from St. Mary’s University School of Law. Follow him on Twitter here.
The contents of this article are subject to the terms and conditions available here.