February’s correction cleared out some excessive optimism — Week of February 27, 2023

| index | wtd | ytd | 1-year | 3-year | 5-year | index level |
|---|---|---|---|---|---|---|
| S&P 500 Index | -2.66 | 3.65 | -5.88 | 10.01 | 9.53 | 3,970.04 |
| Dow Jones Industrial Average | -2.97 | -0.69 | -0.88 | 8.82 | 7.64 | 32,816.92 |
| Russell 2000 Small Cap | -2.86 | 7.49 | -3.93 | 7.65 | 5.39 | 1,890.49 |
| NASDAQ Composite | -3.31 | 9.02 | -14.66 | 9.22 | 10.23 | 11,394.94 |
| MSCI Europe, Australasia & Far East | -1.15 | 6.26 | 1.11 | 5.53 | 3.18 | 2,061.45 |
| MSCI Emerging Markets | -1.16 | 3.38 | -11.64 | 0.46 | -1.40 | 987.74 |
| Barclays U.S. Aggregate Bond Index | -0.34 | 0.73 | -8.62 | -3.44 | 0.60 | 2,063.65 |
| Merrill Lynch Intermediate Municipal | -0.29 | 0.43 | -3.22 | -1.03 | 1.79 | 300.09 |
As of market close February 24, 2023. Returns in percent.
Investment Insights
— Steve Orr
Stepping down
Three weeks of lower stock and bond prices give us hope that traders are coming around to the economic reality. Inflation remains high; supply chains, especially microchips, are not flowing freely; the world is short fertilizer, 155mm shells and willing workers. Are there kids of working age in your basement? Not ours. Jobless claims continue to hover at or below 200,000. Watch for coming tech and retail layoffs to push claims toward 250,000 in the coming months.
Spoiler alert: jobless claims and payrolls are always the last data point to roll over in a recession. Close study of recent recessions reveals that job gains continued for several months past the start of recessions. We are hearing from our real estate contacts that big projects in progress already have funding in place and will be completed. A declining number of new commercial real estate projects are not keeping construction pipelines full. Architecture billings, a leading indicator of nonresidential spending, have been contracting since September.
On the home building front, cancellations are up among subdivision home builders. As projects and homes are finished over the next few months, workers without contracts may turn to filing unemployment claims. As job growth steps down, there may be a small offset in some states from cancellations of shutdown-era support programs. Congress ended the $100 billion annual boost to SNAP recipients last December. Those benefits end in March. According to The Bear Traps Report, food stamps account for more that 10% of dollar-store revenue. There may be additional entrants to the labor market as these support programs roll off.
Same station
Setting aside the “soft,” “no” and “hard” landings for a moment, we hear two trains of thought. The Fed and “soft landing” Perma Bulls point to January’s 517,000 payroll gain as proof the economy is still strong. Removing seasonal adjustments to the jobs data still gets one to fairly strong job growth in January. That was good news back then. The economy is good, so the Fed must raise rates more to choke off hiring. Higher interest rates will hurt stock prices.
Bears are looking ahead. Stock prices and the ability for companies to pay dividends and bond interest rest in the future, not last month. So, their line of thinking is that the economy is deteriorating, and earnings will be worse. Ergo, stock prices need to head lower. Different trains of thoughts arriving at the same station. Let’s agree that the economy has yet to run off the rails but there are clouds on the bridge.
Final look back
Job strength feeding consumer spending is the one strong leg holding up the non-recession stool. Consumer spending over the last three months has outpaced income growth. Overall, consumers are spending more than they are bringing in, either dipping into savings or driving credit card balances higher. This is certainly borne out in the Fed’s revolving consumer credit growth stats, as the bounce higher by the orange line below shows.
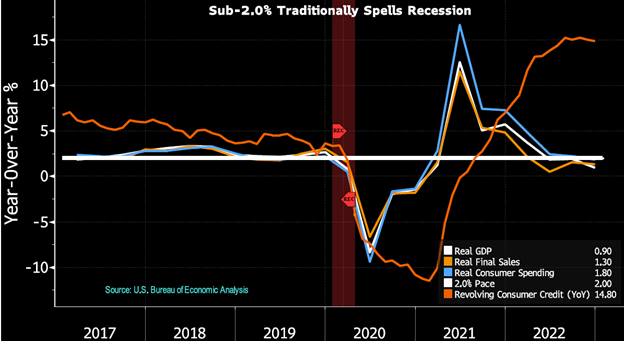
Source: Bloomberg, L.P.
Economists use real activity — nominal dollar totals minus inflation — to get a better sense of whether the economy is growing or not. The late economist Richard Yamarone gets credit for the above chart. He discerned that when real activity in several GDP measures falls below 2% (white line) that a recession occurs within 12 months. Our economy fell to the 2% level late last year and is drifting lower. Looking back 40 years, the 2% threshold is a reliable indicator.
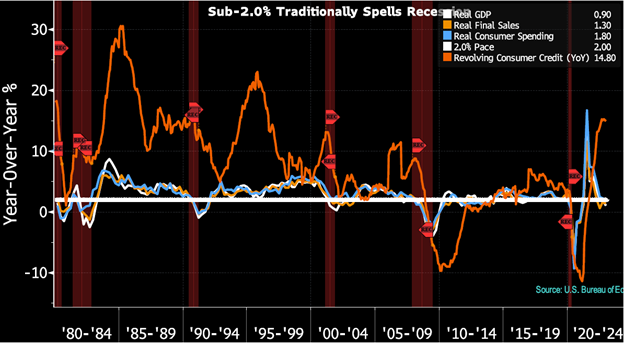
Source: Bloomberg, L.P.
Canyon
Breadth thrusts and longer-term indicators still suggest stocks should be higher nine to 12 months ahead. The last three weeks of negative returns were not enjoyable, but some correction was necessary to work off excessive optimism. The key question for near-term performance is, how deep is the economic canyon we have to cross to get to the other side of Bear Market Forest? We will dive into that question in the coming weeks.
Wrap-up
February is almost in the books. History suggests that the second month usually has flat to down performance. Check that box. Backward looking economic data such as payrolls puts pressure on the Fed to keep raising rates. Forward looking measures say recession is just around the corner. We vote for getting on with it so earnings can recover and pull stocks higher.
For now, our higher-than-normal cash position remains in place and our indicator dashboard is lit with caution lights.
Steve Orr is the Executive Vice President and Chief Investment Officer for Texas Capital Bank Private Wealth Advisors. Steve has earned the right to use the Chartered Financial Analyst and Chartered Market Technician designations. He holds a Bachelor of Arts in Economics from The University of Texas at Austin, a Master of Business Administration in Finance from Texas State University, and a Juris Doctor in Securities from St. Mary’s University School of Law. Follow him on Twitter here.
The contents of this article are subject to the terms and conditions available here.