Good job gains, but details going Fed’s way — Week of April 10, 2023

| index | wtd | ytd | 1-year | 3-year | 5-year | index level |
|---|---|---|---|---|---|---|
| S&P 500 Index | -0.06 | 7.42 | -7.22 | 17.42 | 11.45 | 4,105.02 |
| Dow Jones Industrial Average | 0.69 | 1.62 | -1.08 | 16.27 | 9.30 | 33,485.29 |
| Russell 2000 Small Cap | -2.65 | 0.01 | -11.40 | 16.90 | 4.33 | 1,754.46 |
| NASDAQ Composite | -1.08 | 15.79 | -12.20 | 16.24 | 12.86 | 12,087.96 |
| MSCI Europe, Australasia & Far East | 0.48 | 9.17 | 2.21 | 13.38 | 4.11 | 2,101.06 |
| MSCI Emerging Markets | -0.26 | 3.70 | -9.41 | 6.83 | -0.48 | 987.07 |
| Barclays U.S. Aggregate Bond Index | 0.49 | 3.47 | -2.80 | -2.66 | 1.01 | 2,119.77 |
| Merrill Lynch Intermediate Municipal | 0.77 | 3.23 | 3.06 | 1.12 | 2.33 | 308.45 |
As of market close April 7, 2023. Returns in percent.
Strategy & Positioning
— Steve Orr
Directionless
Light pre-holiday trading last week muted reactions to some pretty interesting data around jobs. Details below. The S&P 500, Dow Industrials and Utilities are in the black for the month. Transports, Mid- and Small-cap stocks drifted back down to mid-March levels. Bond yields continue to bounce along at recent lows. The reversal to lower yields kicked off by Silicon Valley Bank’s failure last month has surprisingly held. Usually once volatility subsides, prices push back toward pre-crisis levels.
The two- and 10-year Note yields staying below those early March levels suggests Mr. Market is concerned about something else. The green hammer candle at the far right shows Friday’s 3.83% yield for the current two-year Treasury is the lowest since last September. The two-year has a pretty fair track record of suggesting where Fed Funds rates will be a year from now. From 5% to 3.83% implies the Fed may make up to five quarter-point decreases in the Fed Funds overnight rate over the next year.
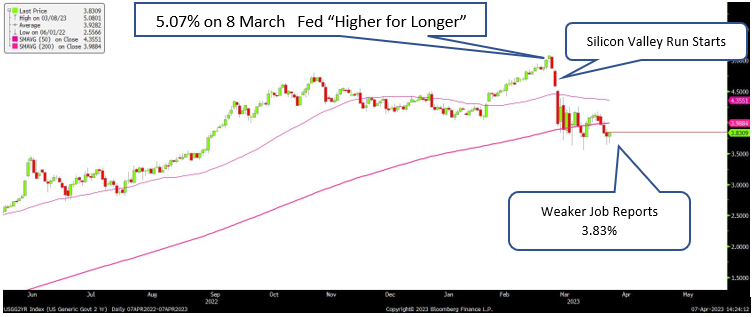
Source: Bloomberg
A “rational” investor (we are still looking for one) would conclude that lower yields and weakening economic data would dampen stock earnings and lower stock prices. The mega-cap eight (Apple, Microsoft, Amazon, Nvidia, Google, Berkshire and Tesla) have held the index up the last several weeks. Note on the chart below after the swoon from the bank failures in mid-March how the big index rallied back up to its October rally trend line (white). We would be impressed if the rally continued in most months, but this is April and seasonal earnings news could keep stocks mired in the directionless back-and-forth of the last four months.
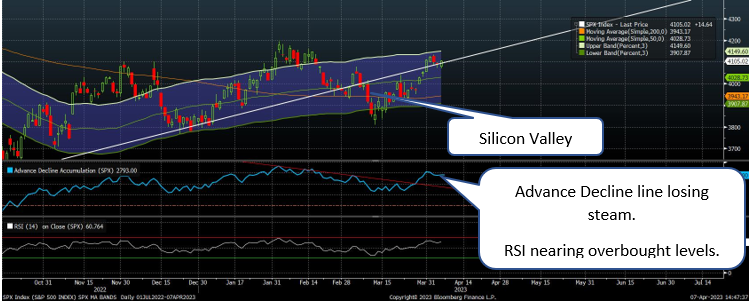
Source: Bloomberg
Jobs, jobs, jobs
More warning signs are out there. We try to keep track of “Warning / Winning” incoming data. Our Winning side is fairly empty these days. The Fed wants to bring down inflation by way of the Beveridge curve. This is not a drinking game, but a progression of job openings and unemployment rates over time. Yes, it is named after a late English economist, and, no, I am not old enough to have met him. William Rodgers and Alice Kassens, writing at the St. Louis Fed’s website, show the movement of the Beveridge relation during and after shutdowns:
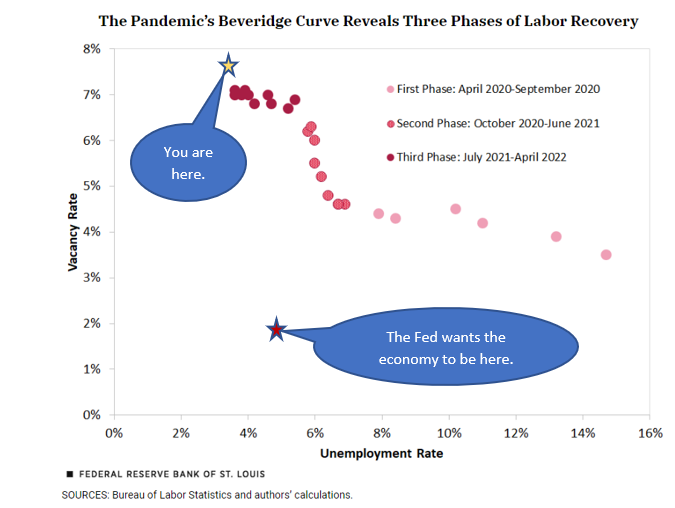
The idea is that raising interest rates would slow job creation by employers. Workers would lose bargaining power and that, in turn, would reduce wage inflation. Unfortunately, raising unemployment from 3.5% to 4.5% would entail the loss of about 1.5 million jobs. The Fed thinks this can happen over the next year or so. We do not like the idea of lost jobs.
Openings
Vacancies and job openings are one and the same. The Bureau of Labor Statistics Job Openings index fell last month for the second month in a row. At 9.93 million job openings, it is now at the lowest level since May 2021. The ratio of openings to unemployed workers fell to 1.67 from 1.86 in January. This suggests that wage pressures are moderating slightly — exactly what the Fed wants.
More claims
Economists are required to be two-handed. They must always have a backup plan for any prediction. They are the worst at office betting pools because they are forced to pick only one outcome. A fair number of researchers and economists have doubted the Labor Department’s weekly jobless claims numbers. Over the last six months, the series skipped below 200,000 per week a number of times. That seemed artificially low and not in keeping with layoff announcements. On the other hand, a strong economy could force companies to hoard workers, making claims lower (see how easy to switch hands?).
The doubters had their day last Thursday as the DoL came out with revisions to the series for the last two years. Sure enough, claims for unemployment, and thus layoffs, had been trending higher. The revised series shows claims between 228,000 and 246,000 for the last several weeks. These are nowhere near recession levels but reflect the increase in layoff announcements. Layoffs can be tracked looking at state WARN filings. This is a 1988 law that requires certain companies to file with state authorities before laying off workers. Texas through mid-March 2022: about 1,200. This year: over 7,000. California for the same time periods: ~6,800 and 25,000. Challenger, Gray & Christmas stated last week that March job cuts announced by U.S.-based employers are running at quadruple year-ago levels. So, job conditions are moving down the Beveridge curve — again to the Fed’s liking.
Less dollars
Finally, last Friday’s payroll report showed another solid job gain of 236,000 last month. Since the start of 2023 non-farm payrolls are up 1.03 million. Most of the gains last month were in government and leisure. Manufacturing job gains continue to deteriorate month over month. Down in the details, annual wages rose at their slowest pace since June 2021, just what the Fed wants. Steady job gains with lower wage growth and sticky inflation are enough to keep the Fed on track to raise rates at least one more time.
Shoe?
The Fed cannot raise rates in a year from zero to nearly 5% and not expect strains or something to break. Our tally so far: crypto, three banks, manufacturing new orders. What shoe will drop next? We have our eyes on any loans that need to be refinanced or rolled over in the next year or so. Even if the Fed has done “enough” and cuts rates late this year, lower quality issuers will still face much higher — in many cases double — rates than a year ago.
Consumer loan volume appears to be falling and nonperformance (late pay) ticking up. Bankers are tightening their lending standards just when firms need more credit as orders slow. In commercial real estate, office space is still oversupplied, but other sectors appear in okay shape. From a rate standpoint at least a third, and by some estimates, half of all commercial real estate debt will need to be refinanced or negotiated over the next two years. Higher financing costs mean tighter margins and lower valuations. Both CoStar and NCREIF reported that owners of all types of commercial properties began writing down their values in the fourth-quarter. Another way to track property valuations is through REIT stocks. The MSCI REIT Index tracks 126 real estate investment trust stocks, many of which are in the commercial sector. That index is down -23% over the last 14 months.
Wrap-up
We are riding the slowest MARE in the economic stable. The Most Anticipated Recession Ever is expected by us and many others to start late this year and extend into 2024. We have some small hope that it is already here, and job declines are just around the corner. Since job losses occur deep into a recession, we would be looking for the (sun)light at the end of the economic tunnel.
Earnings season for the first quarter gets underway this week. The big banks start Friday and estimates for the S&P 500 range from -3% to -7% drop in earnings from 2022’s first quarter. The warnings from Walmart and Costco gave us something to think about. April’s seasonal outperformance track record will be tested the next couple of weeks. Stay cautious.
Steve Orr is the Executive Vice President and Chief Investment Officer for Texas Capital Bank Private Wealth Advisors. Steve has earned the right to use the Chartered Financial Analyst and Chartered Market Technician designations. He holds a Bachelor of Arts in Economics from The University of Texas at Austin, a Master of Business Administration in Finance from Texas State University, and a Juris Doctor in Securities from St. Mary’s University School of Law. Follow him on Twitter here.
The contents of this article are subject to the terms and conditions available here.