Market risks — Week of May 8, 2023

Essential Economics
— Mark Frears
Trepidation
What are you afraid of? My mother was deathly afraid of snakes. Something about my uncle chasing her around as a child. One time the car had been left out in the sun, in a rural parking spot. Snakes like warm surfaces, and had gotten on the hood, by the windshield wipers. She turned on the wipers to clean the glass, and well, at least she did not drive off the road!
Markets tend to swing between fear and greed, and usually not gradually. The past couple of weeks have seen fear in some places.
Bonds
There are many types of bonds, or debt instruments, in the market. Issuers range from municipalities, corporations, government agencies and the U.S. government. As you might imagine, these range in risk and return. The rating agencies (Moody’s, Standard & Poor’s, and Fitch) give us an idea of their risk, but you need to do your own due diligence before you buy. For an example of ratings being suspect, look back at government agency bonds going into the Great Recession.
The most commonly referred-to bond would be the U.S. Treasury (UST). These range from a few weeks to 30 years in maturity. They are considered risk-free, as they are fully backed by the U.S. Government; and spreads to other riskier bonds are stated in a spread from UST rates. The chart below shows the yield curve for the different maturities.
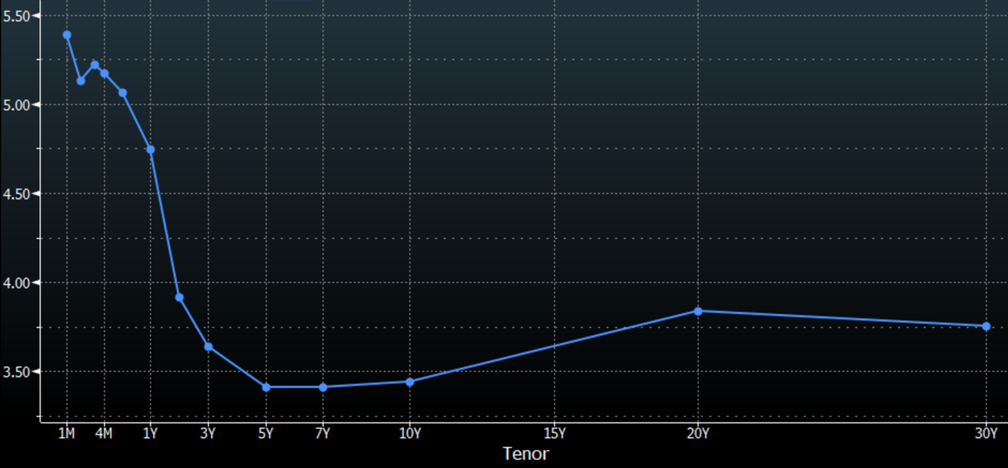
Source: Bloomberg
The shape of this curve is watched closely for clues to the economic future. An inverted curve (as we have now) is indicative of a coming recession, and lower inflation in the future. One thing to keep in mind is that these rates change minute-by-minute (thank you, Doobie Brothers) during the trading day.
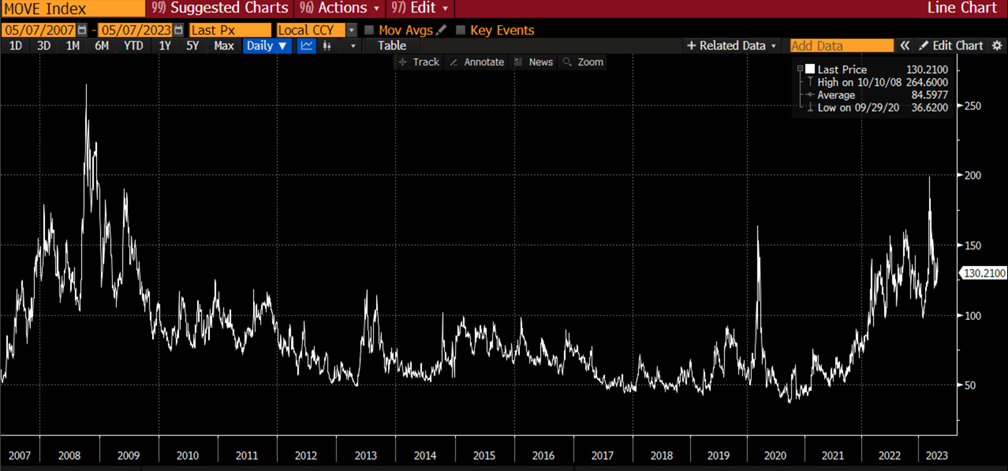
The changes in rates, or volatility, can be a measure of fear. If rates are drastically moving up and down, the uncertainty this implies translates into fear of what is to come. The MOVE Index, shown below, is a measure of this volatility.
Source: Bloomberg
The average MOVE index measure of volatility going back to 2007 has been 84; current reading is 130 and we have recently been as high as 200. Therefore, the inverted curve as well as the volatility would tell you that uncertainty lies ahead. I know, same story, different chapter, but fear is mounting as to some sort of economic slowdown.
Equities
Stocks, as actual ownership in a company, versus a debt holder, should be a great insight into the economy also. The S&P 500 Index (shown below) had been on a solid recovery since the pandemic but has fallen back into a lower range lately.
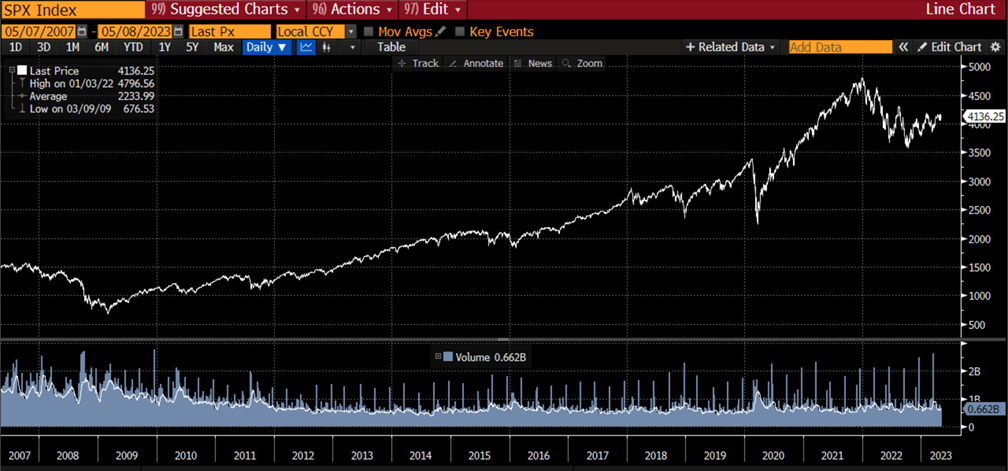
Source: Bloomberg
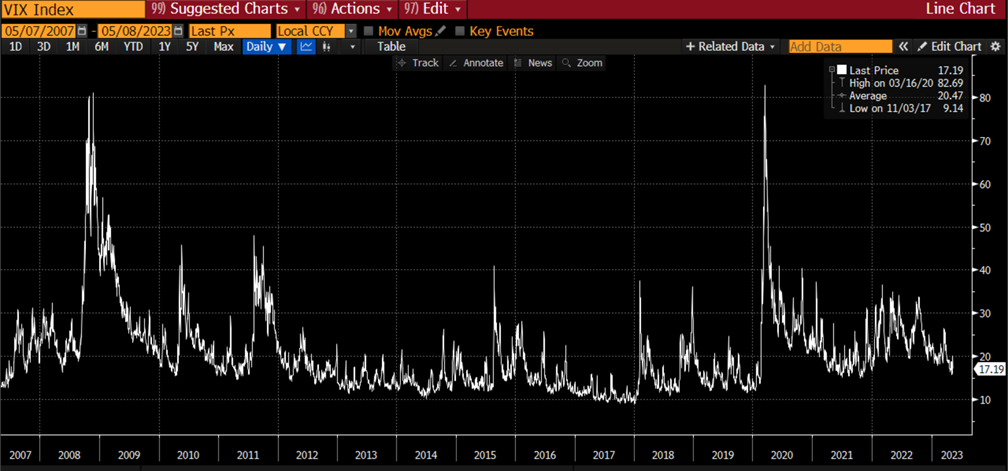
So, stocks are better than the time of the pandemic, but not on the same upward trajectory we would like to see. What about the volatility in equities? There is an Index for that! The VIX Index measures volatility in stock prices on a “Doobie Brothers” level and is commonly known as the Fear Index. Given what has happened in the bond market and other indicators, we would expect to see the same here. As you can see below, the VIX Index is not sending the same signal!
Source: Bloomberg
The current 17 measure is below the long-term average of 20!
If we look closer at recent activity (see below), while the volatility in the financial institutions’ stocks over the past couple of weeks caused an uptick to 20, we were back down at the end of last week.
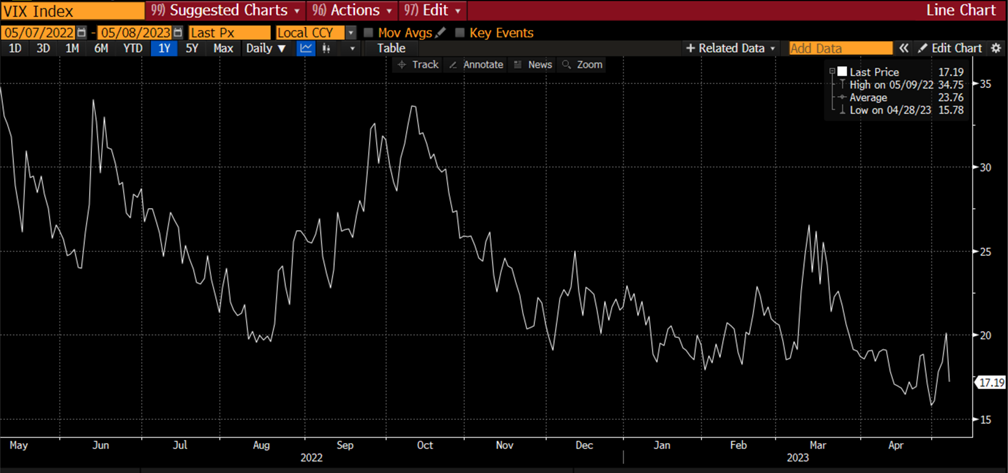
Source: Bloomberg
Why is this metric telling a different story? Why is fear not showing up here? One, credit spreads have remained tight. That means that the spread over UST that company debt trades at is still very low, indicating that companies are not experiencing stress, or even the threat of it. That seems a bit far-fetched, as borrowing rates have risen considerably and costs have increased. The largest mitigant here is that consumers are still spending, discounting any upcoming economic slowdown. Two, the equity market is buying into the potential for the Fed to lower rates later this year. As you can see below, Fed Funds futures predict that rates will be cut this year, reducing borrowing costs for companies.
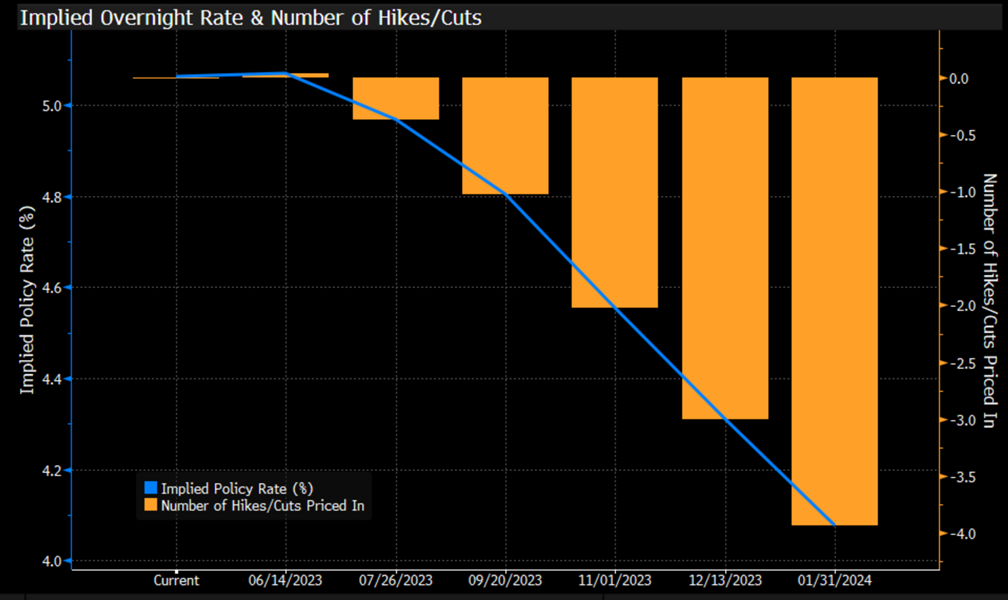
Source: Bloomberg
Fear or not?
Should we be fearful? Who are you listening to? Any “talking head” can give you their opinion and usually has a position that they are basing it on. It is hard to get unbiased direction. Today we have looked at two huge markets and the indicators associated with them, and we can’t get a straight answer! I think that is telling us to be prepared for some sort of slowdown, but the indicators are not yet portraying a severe one. It would be prudent to evaluate your financial risk to see if it is aligned with your comfort level. This is something you should always be cognizant of, but it may be time to take a closer look.
Economic releases
In the past week, the Federal Open Market Committee raised their short-term rate by 25 basis points (0.25%), as expected. Their message was that they are still data dependent, and might take a pause in raising rates, but are still committed to getting inflation back to the 2% level. The payroll release on Friday showed we will have a vibrant labor market, so the waiting for the recession continues.
This week brings the very important Consumer Price Index, as well as Producer Price Index. This will help us get the latest view on inflation. We will also see the consumer’s confidence levels in the University of Michigan release.
Wrap-up
To say you are not scared may be bravado, as most people have some fears. I don’t like to drive in thunderstorms, but if I prepare myself with good tires, reliable windshield wipers and bright headlights, I can feel a bit better. Where are your risks/fears and are you prepared?
| Upcoming Economic Releases: | Period | Expected | Previous | |
|---|---|---|---|---|
| 8-May | Wholesale Inventories MoM | Mar | 0.1% | 0.1% |
| 9-May | NFIB Small Business Optimism | Apr | 89.8 | 90.1 |
| 10-May | Consumer Price Index MoM | Apr | 0.4% | 0.1% |
| 10-May | CPI ex Food & Energy MoM | Apr | 0.3% | 0.4% |
| 10-May | Consumer Price Index YoY | Apr | 5.0% | 5.0% |
| 10-May | CPI ex Food & Energy YoY | Apr | 5.5% | 5.6% |
| 10-May | Real Avg Hourly Earnings YoY | Apr | N/A | -0.7% |
| 10-May | Real Avg Weekly Earnings YoY | Apr | N/A | -1.6% |
| 11-May | Initial Jobless Claims | 6-May | 245,000 | 242,000 |
| 11-May | Continuing Claims | 29-Apr | 1,820,000 | 1,805,000 |
| 11-May | Producer Price Index MoM | Apr | 0.3% | -0.5% |
| 11-May | PPI ex Food & Energy MoM | Apr | 0.2% | -0.1% |
| 11-May | Producer Price Index YoY | Apr | 2.5% | 2.7% |
| 11-May | PPI ex Food & Energy YoY | Apr | 3.3% | 3.4% |
| 12-May | Import Price Index MoM | Apr | 0.3% | -0.6% |
| 12-May | Export Price Index MoM | Apr | 0.2% | -0.3% |
| 12-May | UM (Go MSU) Consumer Sentiment | May | 63.0 | 63.5 |
| 12-May | UM (Go MSU) Current Conditions | May | 67.5 | 68.2 |
| 12-May | UM (Go MSU) Expectations | May | 60.8 | 60.5 |
| 12-May | UM (Go MSU) 1-yr inflation | May | 4.2 | 4.6% |
| 12-May | UM (Go MSU) 5- to 10-yr inflation | May | 2.9% | 3.0% |
Mark Frears is an Investment Advisor, Executive Vice President, at Texas Capital Bank Private Wealth Advisors. He holds a Bachelor of Science from The University of Washington, and an MBA from University of Texas – Dallas.
The contents of this article are subject to the terms and conditions available here.