Housing — Week of May 1, 2023

Essential Economics
— Mark Frears
Shelter
Roofer came and checked; we had no damage from the latest hailstorm. Summer is approaching, so better get the air conditioner tested. Sprinkler maintenance complete, ready for the unenviable task of keeping grass alive in 100-degree temperatures. What is that green stuff growing in the pool; did you check the chlorine? How many bags of mulch will it take to cover the flower beds? This concept of “shelter” is getting a little crazy. Maybe we should sell it, but then we would have to find some other place to keep all these family heirlooms!
Housing is probably your largest expense item, whether you are renting or own a home. As the normally active springtime buying and selling ramps up, how is the housing market looking?
Builders
Coming out of the pandemic, builders’ futures looked very bright. Everything they built was selling; new construction was in demand. Pent-up demand, money in their pockets and low mortgage rates drove a buyers’ market; and the builders of homes profited.
This vibrant market increased the need for workers, materials and land. Due to this high demand, costs started to increase, making it more difficult for builders to make a profit. To a point, people were willing to pay a higher price for their homes, but then the Fed started raising short-term rates, signaling inflation issues and long-term rates rose. The cheap two – three percent mortgages were no longer available.
The chart below shows the 10-year U.S. Treasury (UST) rate, in white, as a good proxy for 20- to 30-year mortgage rates. The blue line is the average overnight Fed Funds rate, driven by the Federal Open Market Committee.
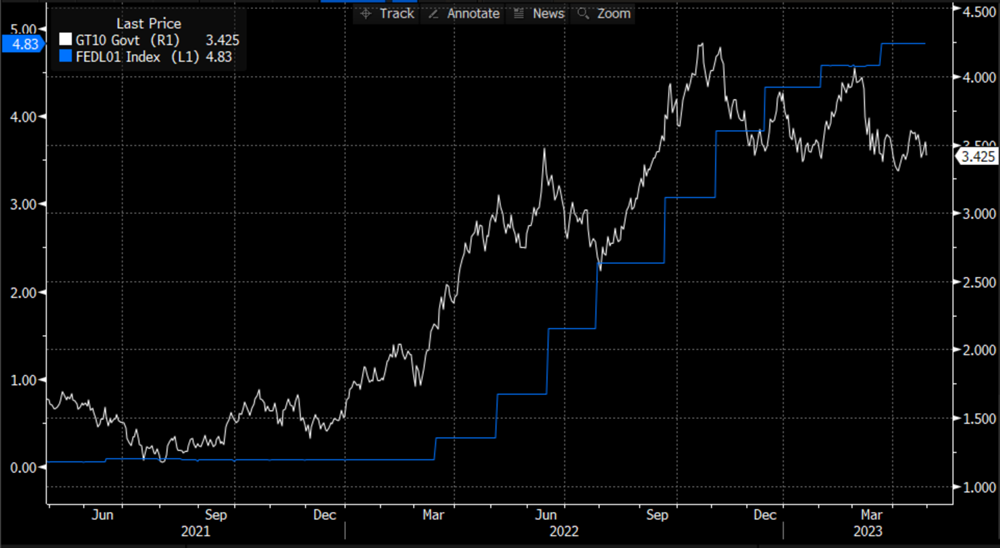
Source: Bloomberg
The long-term UST rate has started to fall, as the belief is that the Fed will be successful in conquering inflation, and rates in the future will be lower. This has started to flow through to lower mortgage rates.
Given the lack of supply in houses on the market (see below), the builder should be able to add to inventory, unless demand heats up even more.
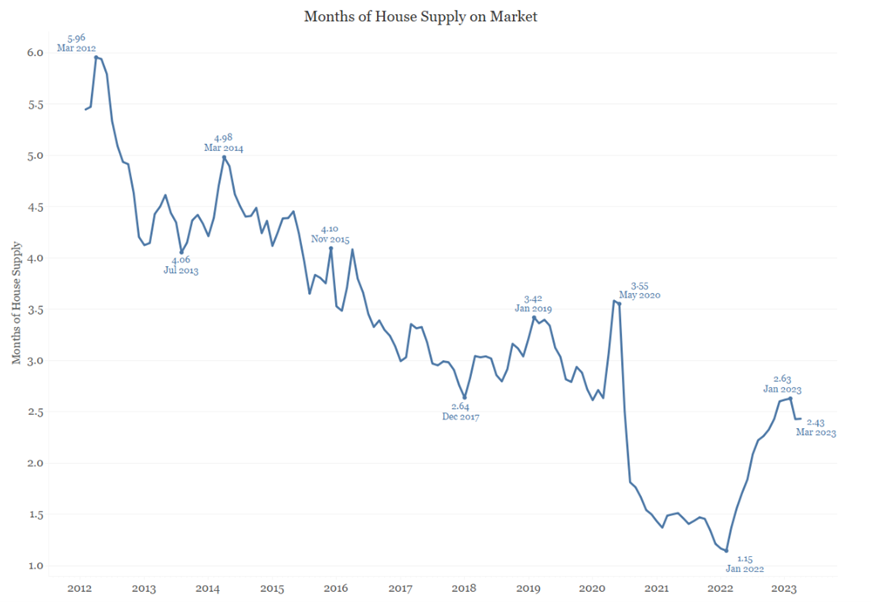
Source: Bianco Research
Existing supply
As I take walks around my neighborhood, For Sale signs are starting to pop up. As school-age children get closer to summer break, parents look at this as the opportunity to move. While some people want a new home, others are looking to be in a certain location and may be looking for a used, or existing, home. The chart below shows sales of these homes. Sales have been increasing since January, but recession talk may have slowed this trend a bit.
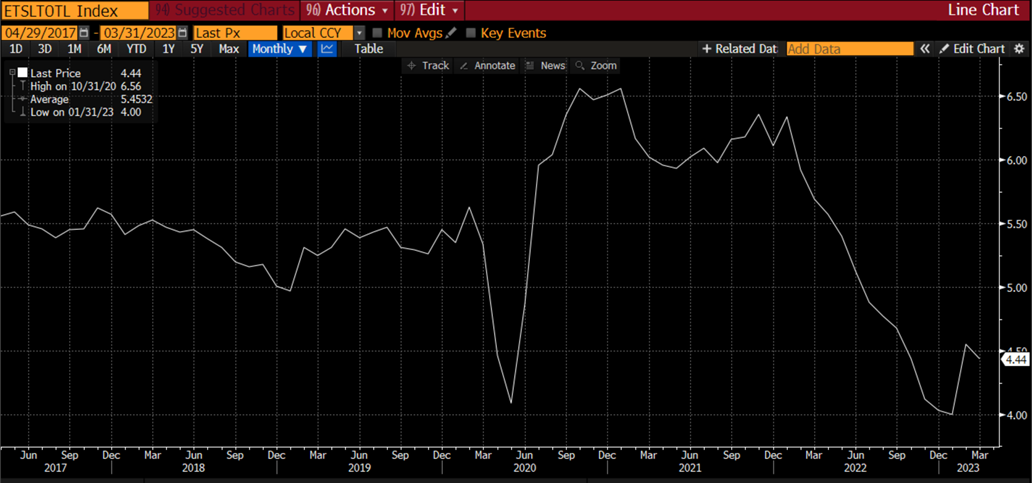
Source: Bloomberg
The sellers of these homes still feel that their abodes have significant value, and in the market a year ago, they may have received top dollar. The chart below shows the slowing demand, due to factors such as economic uncertainty and higher mortgage rates. Sellers are not getting paid what they initially think the house is worth.
Source: Bianco Research
Buyers
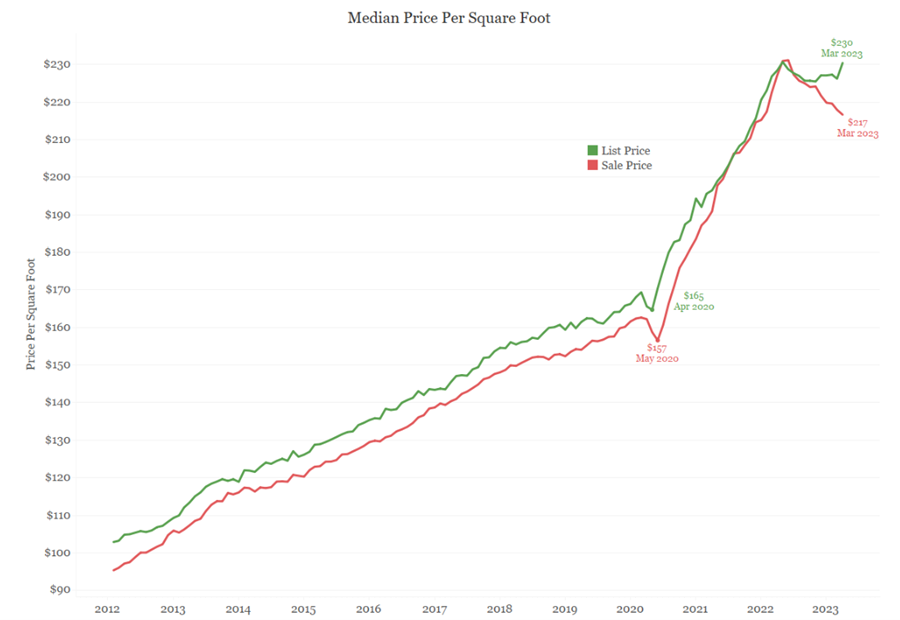
New household formation is one of the areas that is driving demand. Twenty-somethings that have been living in apartments and perhaps, at home, are ready to make that big purchase. The primary thing that was holding them, as well as other buyers, back was lack of supply. Population migrations in certain areas of the country, like Texas, has left a lack of inventory available for purchasers. Consequently, prices were being pushed to levels above reasonable valuations. As you can see below, prices appear to have peaked, at least as they pertain to the Consumer Price Index (CPI).
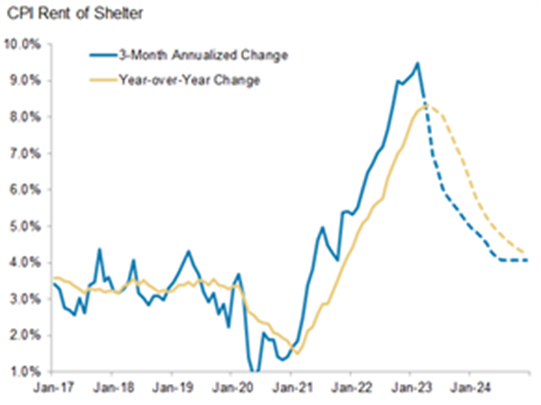
Source: BLS, Morgan Stanley Research forecasts
Even if prices were to come down, there are still the issues of available inventory, higher mortgage rates and the uncertainty about a coming recession.
Most of the charts above show a turning point, and many economists feel that the housing sector has hit bottom. While this does not yet have significant upward momentum, it should help the Fed achieve a softer landing.
Economic releases
The past week was very busy with plenty of economic releases. It was a mixed bag of some high, some low, adding to the economic uncertainty. Consumer Confidence was lower, yet Durable Goods Orders were up. The Employment Cost Index came in above expectations, and that is not a good signal in the Fed’s fight against inflation. A 25-basis point (0.25%) rate hike is baked in.
This week brings the very important employment situation for April, plus some meeting of Fed officials that people seem preoccupied with. We also get Unit Labor Costs and Consumer Credit. Please see below for more information.
Wrap-up
Where we lay our head to sleep at night is very important to us. We must balance this against the cost and, most importantly, the location. Once you decide on the priorities for your living space, this can help you narrow the choices, and hopefully find the right house to make a home. This area of the economy has found some footing, and could add to the foundation for a brighter future down the road.
| Upcoming Economic Releases: | Period | Expected | Previous | |
|---|---|---|---|---|
| 1-May | Construction Spending MoM | Mar | 0.1% | -0.1% |
| 1-May | ISM Manufacturing | Apr | 46.8 | 46.3 |
| 1-May | ISM Prices Paid | Apr | 49.0 | 49.2 |
| 1-May | ISM Employment | Apr | N/A | 46.9 |
| 1-May | ISM New Orders | Apr | N/A | 44.3 |
| 2-May | Factory Orders | Mar | 1.3% | -0.7% |
| 2-May | JOLTS Job Openings | Mar | 9,725,000 | 9,931,000 |
| 2-May | Ward's Total US Vehicle Sales | Apr | 15,000,000 | 14,820,000 |
| 3-May | ADP Employment Change | Apr | 150,000 | 145,000 |
| 3-May | ISM Services Index | Apr | 51.8 | 51.2 |
| 3-May | ISM Services Prices Paid | Apr | N/A | 59.5 |
| 3-May | ISM Services Employment | Apr | N/A | 51.3 |
| 3-May | ISM Services New Orders | Apr | N/A | 52.2 |
| 3-May | FOMC Rate Decision (Upper Bound) | 3-May | 5.25% | 5.00% |
| 3-May | FOMC Rate Decision (Lower Bound) | 3-May | 5.00% | 4.75% |
| 4-May | Nonfarm Productivity | Q1 | -1.8% | 1.7% |
| 4-May | Unit Labor Costs | Q1 | 5.4% | 3.2% |
| 4-May | Initial Jobless Claims | 29-Apr | 240,000 | 230,000 |
| 4-May | Continuing Claims | 22-Apr | 1,873,000 | 1,858,000 |
| 5-May | Change in Nonfarm Payrolls | Apr | 180,000 | 236,000 |
| 5-May | Change in Private Payrolls | Apr | 157,000 | 189,000 |
| 5-May | Unemployment Rate | Apr | 3.6% | 3.5% |
| 5-May | Avg Hourly Earnings MoM | Apr | 0.3% | 0.3% |
| 5-May | Avg Hourly Earnings YoY | Apr | 4.2% | 4.2% |
| 5-May | Labor Force Participation Rate | Apr | 62.6% | 62.6% |
| 5-May | Underemployment Rate | Apr | N/A | 6.7% |
| 5-May | Consumer Credit | Mar | $17.500B | $15.290B |
Mark Frears is an Investment Advisor, Executive Vice President, at Texas Capital Bank Private Wealth Advisors. He holds a Bachelor of Science from The University of Washington, and an MBA from University of Texas – Dallas.
The contents of this article are subject to the terms and conditions available here.