Wages versus Inflation — Week of March 13, 2023

Essential Economics
— Mark Frears
Your worth
In the movie Groundhog Day, towards the end, there is an auction of eligible bachelors. Would you go for two bits or $339.88? I imagine your worth might be a very subjective discussion, but in our current world, employees are a valuable asset. The supply of employable persons has shrunk, yet companies’ desire to hire has continued to build. Something must give for balance to be restored.
Top line
Wage growth has been top-of-mind in inflation fight discussions. The Fed is concerned that the cost of retaining workers will bleed into the prices of goods and services and therefore they will have to continue to raise short-term rates to slow the economy. For the worker, as you can see below, it they are able to earn more for their time spent on the job.
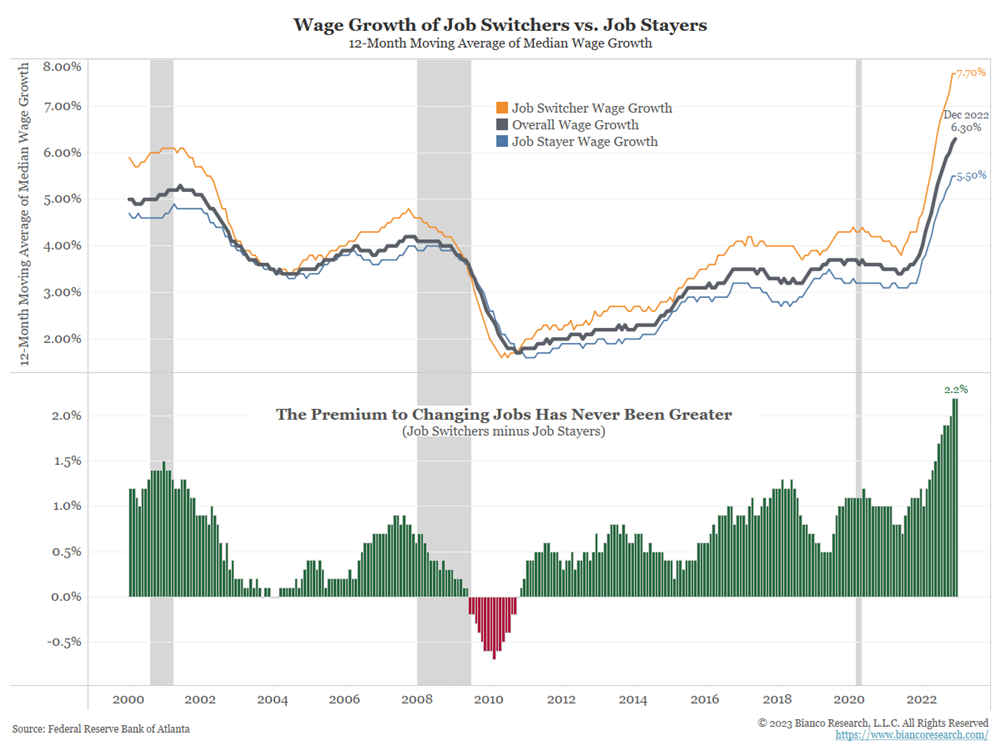
Source: Federal Reserve Bank of Atlanta
The propensity for workers to change jobs for higher wages also causes employers to pay up to retain workers. While this may seem like a good environment for the employee, it does not tell the whole story.
Other sources
In addition to higher pay, the consumer has been working down the savings they accumulated during the pandemic, due to lower expenses and government assistance. This has helped to fuel spending. The spending has continued, even considering a potentially slowing economy. Credit card debt has started to rise, and unlike the credit card hawkers on college campuses spewing false promises about about building credit by incurring debt, it will catch up to you. As you can see below, the credit card debt outstanding for U.S. consumers is on an upswing. The cost to service this debt has continued to rise, and increasing delinquencies will show up before long.
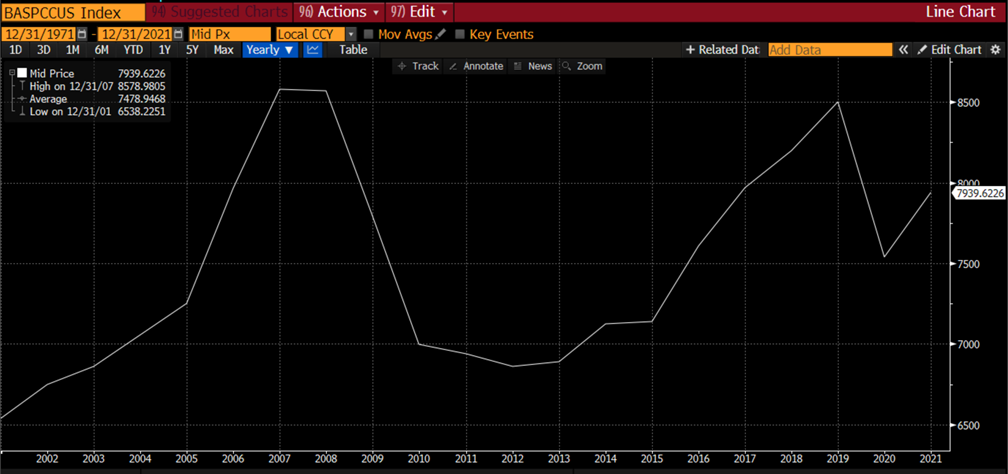
Source: Bloomberg
Consumption
There is much discussion of landings in the financial media. A soft landing would mean no recession, or a mild one at best. This would entail the Fed not having to raise rates much higher, or for much longer, as this would endanger the economic health. A hard landing would have a deeper recession, causing job losses and company earnings to falter. The Fed’s hand in this scenario is for it to continue to raise short-term rates and to leave them higher for longer, pushing the economy into recession.
Based on the Consumer Spending numbers shown below, the consumer is not expecting bad times ahead, as they continue to shop until they drop.
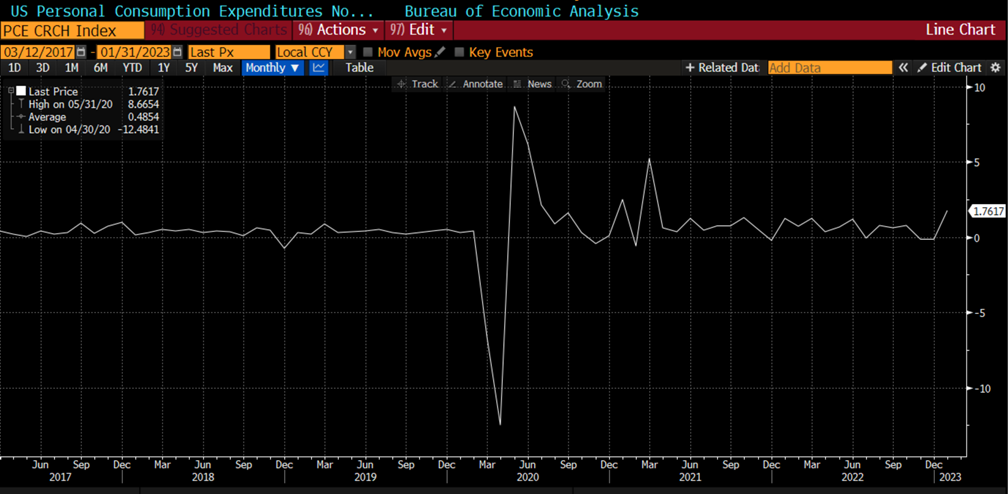
Source: Bloomberg
While they continue to spend, they are not getting as much as they used to. Inflation has eaten into their purchasing power, literally.
One of the Fed’s favorite inflation indicators is Personal Consumption Expenditures (PCE) on a year-over-year basis. As you can see below, the nice downward trend we were seeing has taken a pause.
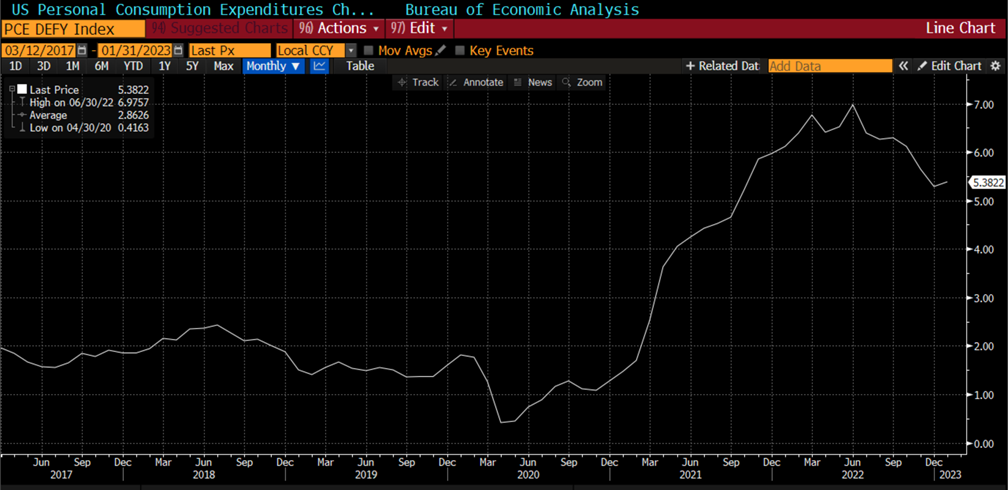
Source: Bloomberg
5.4% is still quite a long way from the 2% Fed target. This means the costs for your food, energy, travel and other daily wants/needs are not coming down anytime soon. Time to start prioritizing where those spending dollars are going.
Looking ahead
For long-term economic health, one positive sign we saw last week was the slowing in the wage component of the Nonfarm Payroll release. While the number of people hired was more than expected, there were some signs of a more balanced payroll situation. First, the unemployment rate and participation rate both rose. Why is that good? It shows more people are entering the workforce, allowing employers to have more options on who they hire. Second, the average hourly wage component shows a slowing pace, as you can see below. While this is not a huge move, it is trending in the right direction.
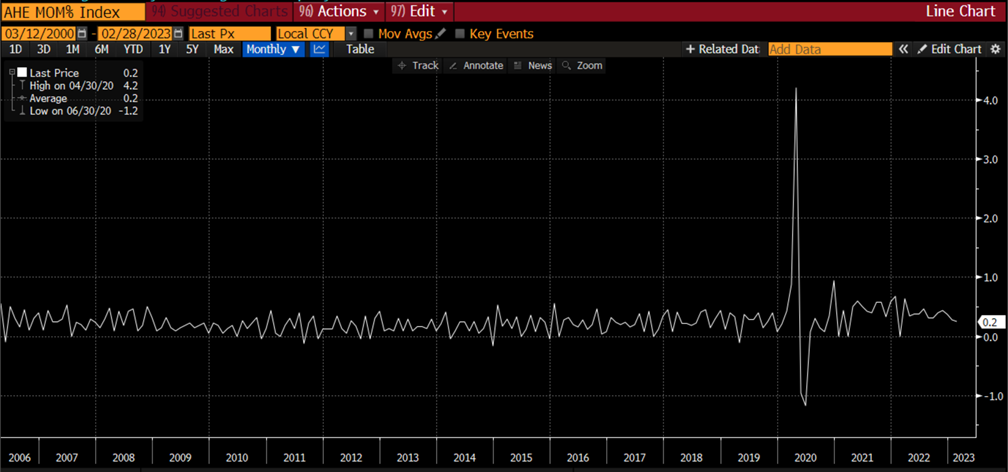
Source: Bloomberg
This week we will have Consumer Price Index, Retail Sales and Producer Price Index releases giving the latest barometers on inflation and economic growth. Please see the chart below for details on these and other releases.
Looking ahead to March 22, we have the next Federal Open Market Committee (FOMC) meeting, where they will share their thoughts on the current and future shape of the economy. The most obvious result will be the size of their rate increase for Fed Fund Target. It is widely expected that they will increase this rate by 25 basis points or 0.25%. If they were to do more or less than this, it would send a message to the markets as to their current view. In addition, we will receive the quarterly Summary of Economic Projections (SEP). We will learn their future insights on Peak FF rate, inflation through the PCE metric, and unemployment.
Wrap-up
Your worth is much more than your job, but right now you are still in the driver’s seat as to your value in the marketplace. Even though your days may seem like a rerun of <em>Groundhog Day</em>, hopefully you don’t have to listen to Sonny and Cher every day.
| Upcoming Economic Releases: | Period | Expected | Previous | |
|---|---|---|---|---|
| 14-Mar | NFIB Small Business Optimism | Feb | 90.2 | 90.3 |
| 14-Mar | Consumer Price Index MoM | Feb | 0.4% | 0.5% |
| 14-Mar | CPI ex Food & Energy MoM | Feb | 0.4% | 0.4% |
| 14-Mar | Consumer Price Index YoY | Feb | 6.0% | 6.4% |
| 14-Mar | CPI ex Food & Energy YoY | Feb | 5.5% | 5.6% |
| 15-Mar | Producer Price Index MoM | Feb | 0.3% | 0.7% |
| 15-Mar | PPI ex Food & Energy MoM | Feb | 0.4% | 0.5% |
| 15-Mar | Producer Price Index YoY | Feb | 5.4% | 6.0% |
| 15-Mar | PPI ex Food & Energy YoY | Feb | 5.2% | 5.4% |
| 15-Mar | Empire Manufacturing | Mar | (8.0) | (5.8) |
| 15-Mar | Retail Sales MoM | Feb | -0.4% | 3.0% |
| 15-Mar | Retail Sales ex Autos MoM | Feb | -0.1% | 2.3% |
| 15-Mar | Business Inventories | Jan | 0.0% | 0.3% |
| 15-Mar | NAHB Housing Market Index | Mar | 41 | 42 |
| 16-Mar | Initial Jobless Claims | 11-Mar | 205,000 | 211,000 |
| 16-Mar | Continuing Claims | 4-Mar | 1,698,000 | 1,718,000 |
| 16-Mar | Import Price Index MoM | Feb | -0.2% | -0.2% |
| 16-Mar | Export Price Index MoM | Feb | -0.3% | 0.8% |
| 16-Mar | Building Permits | Feb | 1,346,000 | 1,339,000 |
| 16-Mar | Building Permits MoM | Feb | 0.5% | 0.1% |
| 16-Mar | Housing Starts | Feb | 1,310,000 | 1,309,000 |
| 16-Mar | Housing Starts MoM | Feb | 0.1% | -4.5% |
| 16-Mar | Philadelphia Fed Business Outlook | Mar | (15.0) | (24.3) |
| 16-Mar | NY Fed Services Business Activity | Mar | N/A | (12.8) |
| 17-Mar | Industrial Production MoM | Feb | 78.5% | 78.3% |
| 17-Mar | Capacity Utilization | Feb | 0.2% | 1.0% |
| 17-Mar | Leading Index | Feb | -0.3% | -0.3% |
| 17-Mar | UM (Go MSU) Consumer Sentiment | Mar | 67.0 | 67.0 |
| 17-Mar | UM (Go MSU) Current Expectations | Mar | N/A | 70.7 |
| 17-Mar | UM (Go MSU) Expectations | Mar | 64.8 | 64.7 |
| 17-Mar | UM (Go MSU) 1-yr inflation | Mar | 4.0% | 4.1% |
| 17-Mar | UM (Go MSU) 5- to 10-yr inflation | Mar | 2.9% | 2.9% |
Mark Frears is an Investment Advisor, Executive Vice President, at Texas Capital Bank Private Wealth Advisors. He holds a Bachelor of Science from The University of Washington, and an MBA from University of Texas – Dallas.
The contents of this article are subject to the terms and conditions available here.