Two-thirds of the economy — Week of June 5, 2023

Essential Economics
— Mark Frears
Adaptation
As time goes along, what was once strange becomes normal. When we had our first child, we were amazed they would allow us to take him home, as we had no clue! Over time, we learned what to do, how to handle the daily tasks involved in raising a child. A huge responsibility, but it became more normal.
The economic pundits continue to tell us we are in a recession and/or approaching one. Also, inflation continues to be stubbornly high, yet with all this uncertainty, the consumer seems to be adapting. Can it last?
Making a living
The primary factor that drives consumer habits is whether they have an income and/or their prospects for obtaining a job if they lose the current one. Last Friday we had the most recent update on the labor market with the Nonfarm Payroll release. The headline stated that we added 339,000 jobs in the U.S. in May, well above the consensus estimate of 195,000. In fact, for the last 14 months, actual numbers have exceeded expectations. As you can see below, there is a downward trend, yet the number of jobs added monthly continues to show a strong labor force.
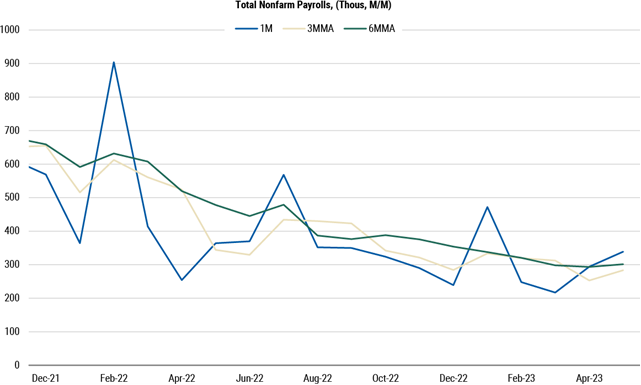
Source: Morgan Stanley
There was some underlying weakness in this month’s report. The unemployment rate ticked up a bit, due to fewer new workers in the household survey; plus wages and workweek slowed in May. As you can see below, the wages component is running over 4% on a year-over-year basis, still above the long-term average.
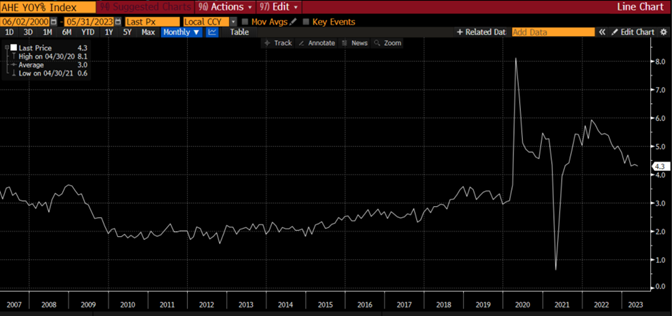
Source: Bloomberg
The Employment Cost Index measures changes in compensation and incorporates direct (wages) as well as indirect (benefits and training) costs. It is a better measure of total benefit to the employee and cost to the employer. As you can see below, this index is still at multi-decade highs. Good for the employee, yet costly for the employer and cause for concern at the Fed.
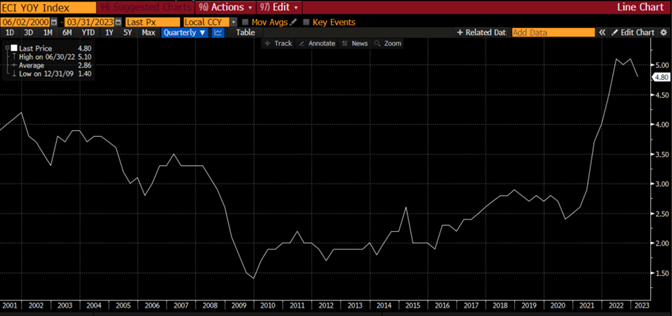
Source: Bloomberg
Spending
The consumer continues to shop, based on Personal Income and Spending numbers. On a year-over-year basis, spending increased 6.7% and income was up 5.4%.
On the other side of the coin, the Conference Board’s Consumer Confidence number declined to a six-month low in May. There is some concern about the longer-term strength of the labor market, as well as uncertainty associated with the debt ceiling deal that was reached last week. Yes, they kicked the can down the road again without addressing any real issues. If this trend continues, spending will pull back and the economy will slow.
Another concern on the spending front is how much of this is being fueled by credit cards. The nation’s credit card debt stands at $986 billion, according to the Federal Reserve. Given the average rate on balances is north of 20%, this is not a sustainable source of spending. As you can see below, charge offs are increasing before the unemployment rate ticks up.
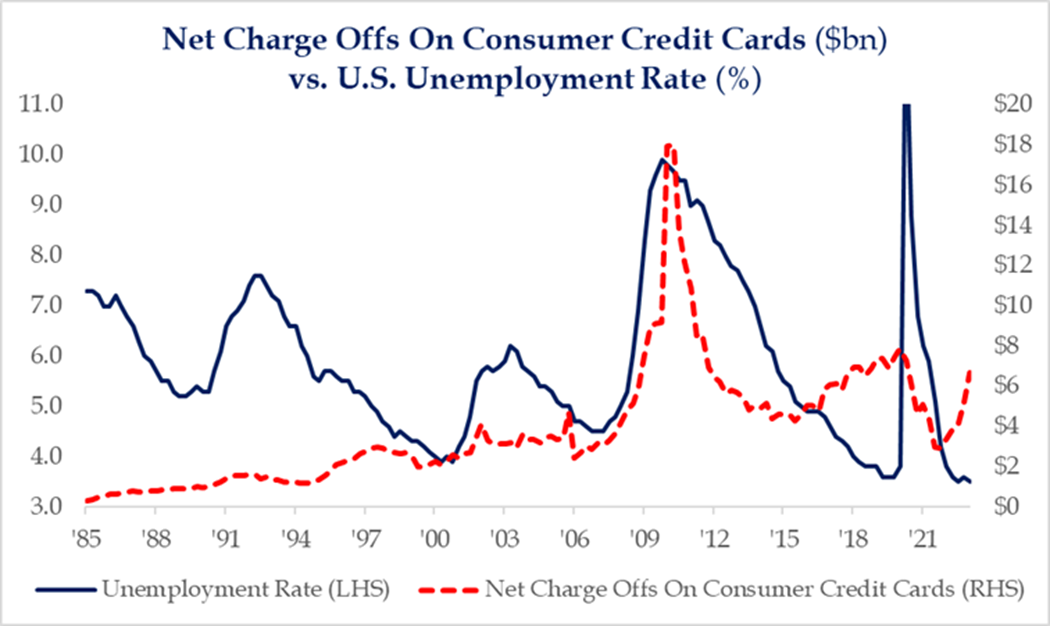
Source: Strategas Research
Also, when student loan payments are restarted, this will cause an additional headwind for consumers.
Housing
We have been hearing of falling home prices and some opportunity for better affordability, but the demand for houses has picked up and prices as well. As you can see below, in March we saw the first increase in prices since mid-2022.
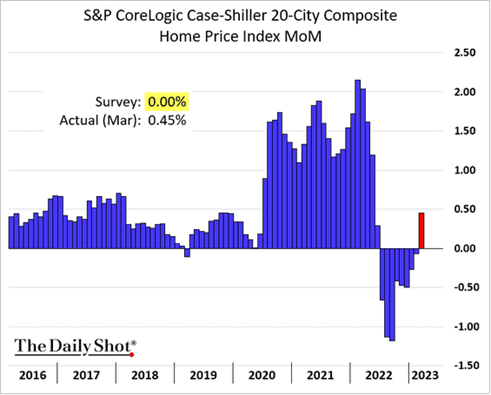
Source: S&P CorLogic Case-Shiller
Demand for houses continues to dwarf the supply available. Therefore, the gap between home prices and wages continues to widen as seen below.
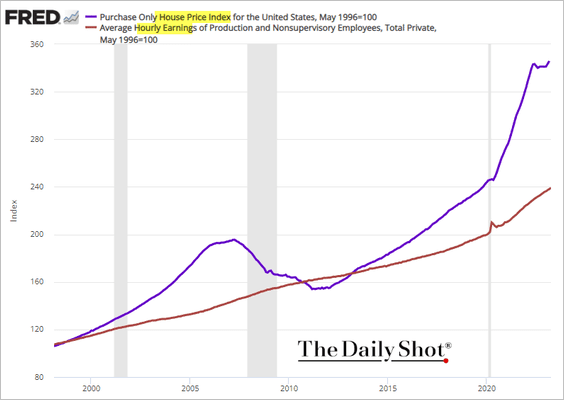
Source: FRED St Louis
Another factor contributing to the lack of supply for individuals is the demand by institutional investors for houses. While investor home purchases fell 49% on a year-over-year basis in the first quarter of this year, they still buy 18% of homes sold. This is down from a peak of 20% a year earlier but higher than pre-pandemic.
All these factors are making it difficult to purchase a home at affordable levels. Can the consumer’s budget adapt to these conditions without larger consequences?
Inflation?
Are prices still too high? Yes. You can look at the Consumer Price Index (CPI), the Personal Consumption Expenditure (PCE), or the Underlying Inflation Gauge (UIG) and they are all well above long-term averages, applying strain to consumers’ budgets.
The Fed has taken short-term rates up at an unprecedented pace, attempting to mitigate inflation. While we have seen some slowing in the inflation metrics, it is a huge task to offset the liquidity in the system, chasing too few goods. Their Quantitative Tightening plan continues to take liquidity out of the system, but at a slow pace.
Based on Strategas’ Consumer Stress Indicator (see below), there has been some easing of conditions.
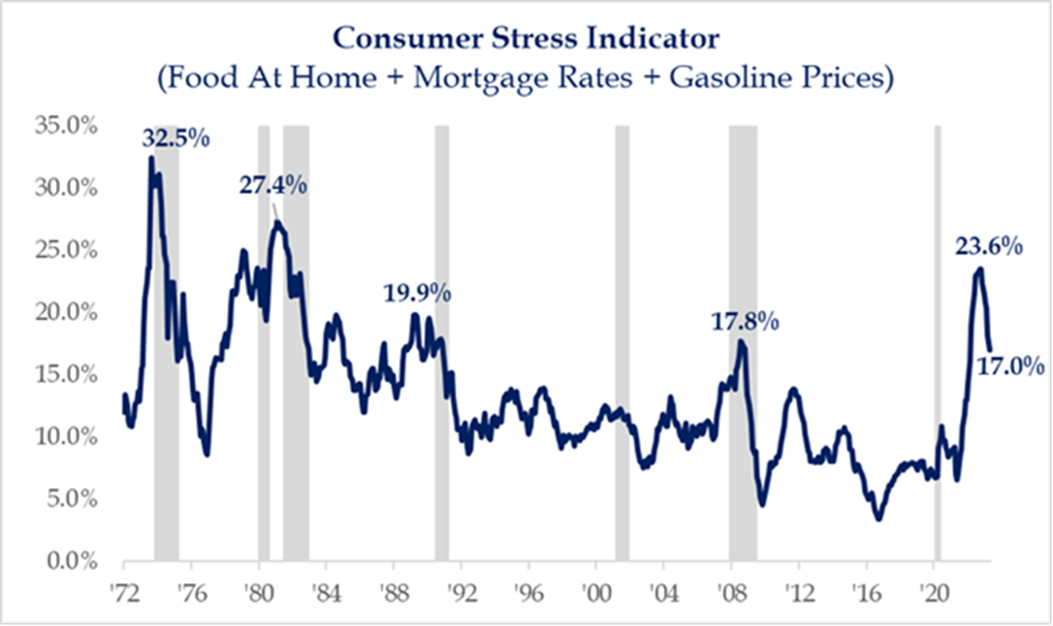
Source: Strategas Research
While increasing wages have helped to fuel spending, they are not keeping up with inflation. In addition, lower income constituents are feeling this impact at a much higher level.
Economic releases
The past week we saw labor market metrics still reflecting a solid job environment. There are a few cracks starting to show, but overall jobs are plentiful.
This week has a light schedule of releases. The ISM Services Index for May and Consumer Credit for April are the ones to watch. See below for details.
Essential Economics
— Mark Frears
Adaptation
As time goes along, what was once strange becomes normal. When we had our first child, we were amazed they would allow us to take him home, as we had no clue! Over time, we learned what to do, how to handle the daily tasks involved in raising a child. A huge responsibility, but it became more normal.
The economic pundits continue to tell us we are in a recession and/or approaching one. Also, inflation continues to be stubbornly high, yet with all this uncertainty, the consumer seems to be adapting. Can it last?
Making a living
The primary factor that drives consumer habits is whether they have an income and/or their prospects for obtaining a job if they lose the current one. Last Friday we had the most recent update on the labor market with the Nonfarm Payroll release. The headline stated that we added 339,000 jobs in the U.S. in May, well above the consensus estimate of 195,000. In fact, for the last 14 months, actual numbers have exceeded expectations. As you can see below, there is a downward trend, yet the number of jobs added monthly continues to show a strong labor force.
Source: Morgan Stanley
There was some underlying weakness in this month’s report. The unemployment rate ticked up a bit, due to fewer new workers in the household survey; plus wages and workweek slowed in May. As you can see below, the wages component is running over 4% on a year-over-year basis, still above the long-term average.
Source: Bloomberg
The Employment Cost Index measures changes in compensation and incorporates direct (wages) as well as indirect (benefits and training) costs. It is a better measure of total benefit to the employee and cost to the employer. As you can see below, this index is still at multi-decade highs. Good for the employee, yet costly for the employer and cause for concern at the Fed.
Source: Bloomberg
Spending
The consumer continues to shop, based on Personal Income and Spending numbers. On a year-over-year basis, spending increased 6.7% and income was up 5.4%.
On the other side of the coin, the Conference Board’s Consumer Confidence number declined to a six-month low in May. There is some concern about the longer-term strength of the labor market, as well as uncertainty associated with the debt ceiling deal that was reached last week. Yes, they kicked the can down the road again without addressing any real issues. If this trend continues, spending will pull back and the economy will slow.
Another concern on the spending front is how much of this is being fueled by credit cards. The nation’s credit card debt stands at $986 billion, according to the Federal Reserve. Given the average rate on balances is north of 20%, this is not a sustainable source of spending. As you can see below, charge offs are increasing before the unemployment rate ticks up.
Source: Strategas Research
Also, when student loan payments are restarted, this will cause an additional headwind for consumers.
Housing
We have been hearing of falling home prices and some opportunity for better affordability, but the demand for houses has picked up and prices as well. As you can see below, in March we saw the first increase in prices since mid-2022.
Source: S&P CorLogic Case-Shiller
Demand for houses continues to dwarf the supply available. Therefore, the gap between home prices and wages continues to widen as seen below.
Source: FRED St Louis
Another factor contributing to the lack of supply for individuals is the demand by institutional investors for houses. While investor home purchases fell 49% on a year-over-year basis in the first quarter of this year, they still buy 18% of homes sold. This is down from a peak of 20% a year earlier but higher than pre-pandemic.
All these factors are making it difficult to purchase a home at affordable levels. Can the consumer’s budget adapt to these conditions without larger consequences?
Inflation?
Are prices still too high? Yes. You can look at the Consumer Price Index (CPI), the Personal Consumption Expenditure (PCE), or the Underlying Inflation Gauge (UIG) and they are all well above long-term averages, applying strain to consumers’ budgets.
The Fed has taken short-term rates up at an unprecedented pace, attempting to mitigate inflation. While we have seen some slowing in the inflation metrics, it is a huge task to offset the liquidity in the system, chasing too few goods. Their Quantitative Tightening plan continues to take liquidity out of the system, but at a slow pace.
Based on Strategas’ Consumer Stress Indicator (see below), there has been some easing of conditions.
Source: Strategas Research
While increasing wages have helped to fuel spending, they are not keeping up with inflation. In addition, lower income constituents are feeling this impact at a much higher level.
Economic releases
The past week we saw labor market metrics still reflecting a solid job environment. There are a few cracks starting to show, but overall jobs are plentiful.
This week has a light schedule of releases. The ISM Services Index for May and Consumer Credit for April are the ones to watch. See below for details.
Wrap-Up
The citizens of the United States are a strong, adaptable people. There has been much strain on their budgets due to higher prices. When we look back at this time, it will be very interesting to see the long-term impact on spending habits and what the new normal looks like.
| Upcoming Economic Releases: | Period | Expected | Previous | |
|---|---|---|---|---|
| 5-Jun |
S&P Global US Services PMI |
May | 55.1 | 55.1 |
| 5-Jun | S&P Global US Composite PMI | May | 54.5 | 54.5 |
| 5-Jun | Factory Orders | Apr | 0.8% | 0.9% |
| 5-Jun | ISM Services Index | May | 52.4 | 51.9 |
| 5-Jun | ISM Services Prices Paid Index | May | N/A | 59.6 |
| 5-Jun | ISM Services Employment Index | May | N/A | 50.8 |
| 5-Jun | ISM Services New Orders Index | May | N/A | 56.1 |
| 7-Jun | Consumer Credit | Apr | $22.000B | $26.514B |
| 8-Jun | Initial Jobless Claims | 3-Jun | 237,000 | 232,000 |
| 8-Jun | Continuing Claims | 27-May | 1,802,000 | 1,795,000 |
| 8-Jun | Wholesale Inventories MoM | Apr | -0.2% | -0.2% |
| 8-Jun | Household Change in Net Worth | Q1 | N/A | $2,927B |
Mark Frears is an Investment Advisor, Executive Vice President, at Texas Capital Bank Private Wealth Advisors. He holds a Bachelor of Science from The University of Washington, and an MBA from University of Texas – Dallas.
The contents of this article are subject to the terms and conditions available here.