What’s your interest rate? — Week of June 26, 2023

Essential Economics
— Mark Frears
Question
How are you doing today? Sounds like a harmless question unless someone tells you the truth! Another one is “what did you do over the weekend?”; do they want the truth, or a sanitized version? I feel this way when someone asks, “what are rates going to do?” That is a loaded question!
The markets have more rates than you can shake a stick at, so you need to dig deeper! This is one page off Bloomberg…. don’t worry, we are not going to cover all of these!
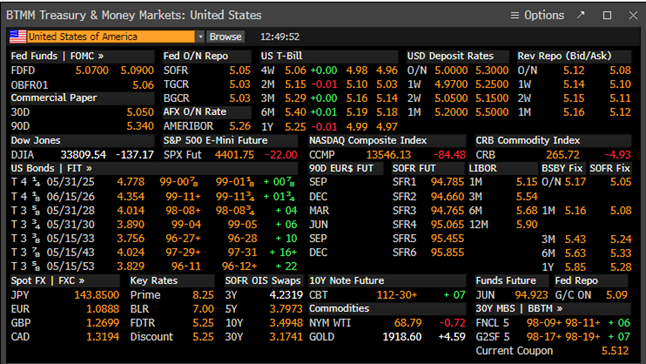
Source: Bloomberg
Shorter-term
The Federal Open Market Committee (FOMC) influences much of the short-term market with where they set the overnight Fed Funds (FF) target trading rate. Cash needs for the U.S. Treasury (UST) can drive short-term Treasury Bill rates as well. Also, the view on near-term moves by the FOMC will impact rates 12 months and shorter. As you can see below, right now the short end of the UST curve has the highest rates, with the current FF target rate at 5–5.25%.
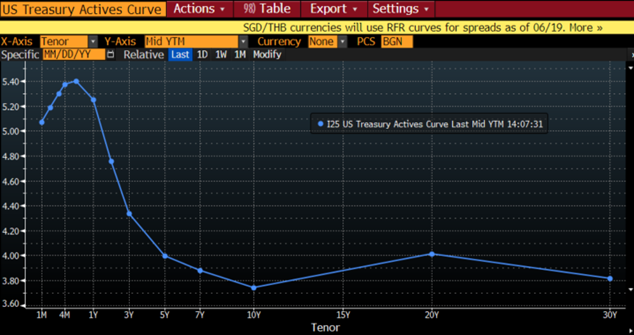
Source: Bloomberg
Longer-term
Looking at the chart above, anything over one-year in maturity is considered long-term. Obviously, bonds/investment with maturities close to one-year will be influenced by the rates discussed above. Once you get further out the curve, or longer maturities, there is much more nuance as to what drives the rates. Ultimately, it is the view of the market on whether inflation (need for higher rates) or recession (expected lower rates) has more weight. This view and basic supply and demand concepts are the primary factors in arriving at long-term rates. Keep in mind this is a dynamic environment, with rates constantly changing, taking in new information constantly.
In addition, there are technicians who follow trends such as moving averages, trading ranges (both shown below), candlestick charts, trading volume and Fibonacci levels.
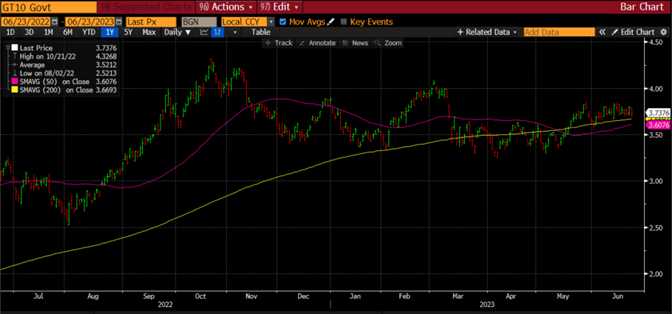
Source: Bloomberg
This support/resistance and trend information can be very useful in gaining insight as to future rate movements. Some might even say that so many people watch these technical levels, that they can become a self-fulfilling prophecy.
Loans
As a borrower, you would like to see low rates, and conversely, as a lender, you want higher rates. Again, when someone asks if rates are good for borrowing/lending, they need to specify the term of the loan. Banks trade FF on a bank-to-bank basis somewhere close to the FOMC target rate. Currently they are paying/receiving 5.06%. Commercial clients usually borrow from banks on a variable basis that is re-set every month. Current one month Secured Overnight Funding Rate (SOFR) is trading at 5.08%. You could ask why they are borrowing for one month based on an overnight rate, but we don’t have the time to go into that!
Consumer mortgages are a very closely monitored rate, as it can drive the broad housing market, and is the largest debt for the borrower. If we look at the 30-year UST rate as a benchmark for mortgage rates, you can see below that while rates have increased since 2020, we are still at historically attractive rates.
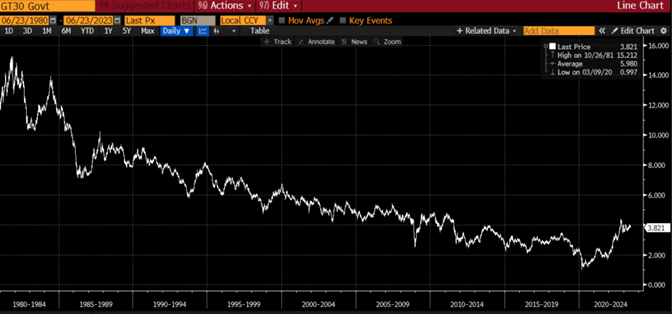
Source: Bloomberg
The issue here is that people got spoiled with very low rates from 2010 to 2020, and anything above that now seems “high.” This has caused some borrowers to put off buying a home. In addition, the supply of homes is not keeping up with the demand, driving prices higher. We continue to watch mortgage rates as an insight regarding the overall housing market, but as it is a long-term rate, the view on inflation or recession will be a primary driver.
Deposits
Most people are looking to deposit money on a short-term basis. They usually have a goal in mind that they will need the money for. That may be an emergency fund, saving up for a car, putting money away for a trip. I know these may seem like old-fashioned ideas, versus putting the expense on your credit card (at 24% interest), but bear with me.
As you can see below, the FF rate going back to 2010 has been close to zero until recently.
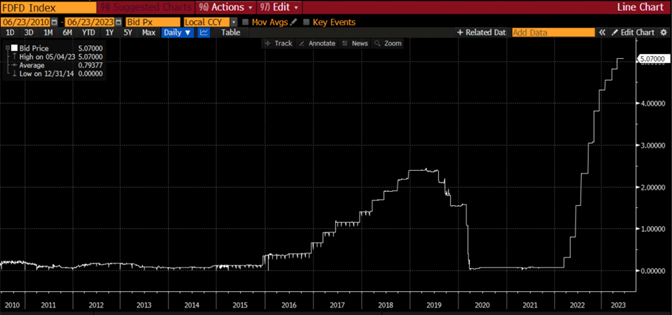
Source: Bloomberg
Now, people who are parking money in money market savings accounts, certificates of deposit, money market mutual funds or UST can earn a nice return! This is especially good for people on fixed incomes, generally senior citizens, who can now have more spending money!
Conversely, the banks and funds that are paying these rates are faced with the bigger challenge of investing these funds to provide a higher return. Two sides to each rate, and each tenor, or maturity; do you have the cash, or need the cash?
Real rates
OK, we have been looking at all sorts of rates, but now there is this concept of Real Rates. So, all these rates we have been looking at are not real?! A real interest rate takes the observed market rate and subtracts the rate of inflation. So, it tells you if rates are keeping up with inflation or if you are losing ground. As you can see below, the real FF rate is now positive and this is a big deal, as it has been mostly negative going back to the Great Recession.
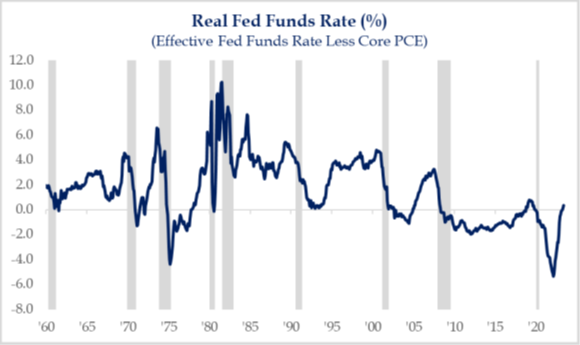
Source: Strategas Research
You can look at this for any term/maturity of interest rate, and there is some subjectivity as to the measure of inflation. As you can see below, the real 10-year UST (using the FOMC favorite measure of inflation) is still negative but making a move toward zero.
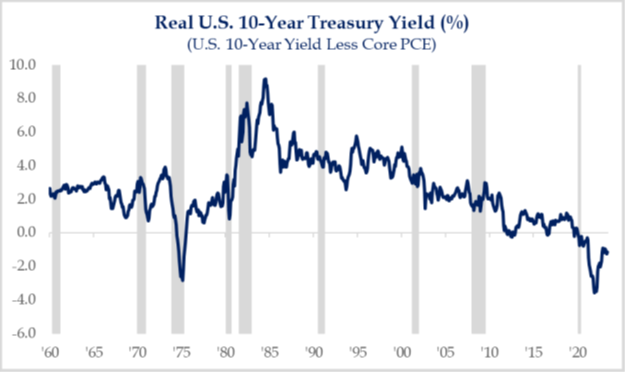
Source: Strategas Research
Why is this important? First, it is good to have a return, whether borrowing or lending, that keeps you ahead of inflation. If you don’t take this into consideration, you miss out on a significant part of total return. Second, it shows the FOMC that they are making progress, and are closer to their goal of price stability. This should result in a slower pace of any potential future tightening. Third, the U.S. and Canada are the only countries with positive real central bank policy rates, indicating economies set up for future growth.
Economic releases
Last week was dominated by the hawkish pause from the FOMC and the surprise 50 basis points (0.50%) rate hike from the Bank of England. The uncertainty of future moves kept the markets unsettled.
This week, we have a plethora of data highlighted by Durable Goods Orders, Conference Board’s Consumer Confidence, Personal Income and Spending, PCE Deflator, and UofM Consumer Sentiment. See below for details.
Wrap-Up
Now, when someone asks you about “rates,” you can ask them which rates they are referring to! There is much to be gained from watching these different areas of the rate curve, and what is driving the differences. And, if someone asks you how you are, try surprising them with the truth!
| Upcoming Economic Releases: | Period | Expected | Previous | |
|---|---|---|---|---|
| 26-Jun |
Dallas Fed Manufacturing Activity |
Jun | (20.0) | (29.1) |
| 27-Jun | Durable Goods Orders | May | -0.9% | 1.1% |
| 27-Jun | Durable Goods ex Transportation Cap Goods Orders Nondef ex |
May | 0.0% | -0.3% |
| 27-Jun | Aircraft | May | 0.2% | 1.3% |
| 27-Jun | FHFA House Price Index MoM | Apr | 0.5% | 0.6% |
| 27-Jun | S&P CoreLogic 20-city YoY | Apr | -2.60% | -1.15% |
| 27-Jun | New Home Sales | May | 675,000 | 683,000 |
| 27-Jun | New Home Sales MoM | May | -1.2% | 4.1% |
| 27-Jun | Conf Board Consumer Confidence | Jun | 104.0 | 102.3 |
| 27-Jun | Conf Board Present Situation | Jun | N/A | 148.6 |
| 27-Jun | Conf Board Expectations | Jun | N/A | 71.5 |
| 27-Jun | Richmond Fed Manufacturing Index | Jun | (12) | (15) |
| 27-Jun | Richmond Fed Business Conditions | Jun | N/A | (17) |
| 27-Jun | Dallas Fed Services Activity | Jun | N/A | (17.3) |
| 28-Jun | Wholesale Inventories MoM | May | -0.1% | -0.1% |
| 28-Jun | Retail Inventories MoM | May | N/A | 0.2% |
| 29-Jun | Initial Jobless Claims | 24-Jun | 265,000 | 264,000 |
| 29-Jun | Continuing Claims | 17-Jun | 1,779,000 | 1,759,000 |
| 29-Jun | GDP Annualized QoQ | Q1 | 1.4% | 1.3% |
| 29-Jun | Personal Consumption | Q1 | 3.8% | 3.8% |
| 29-Jun | GDP Price Index | Q1 | 4.2% | 4.2% |
| 29-Jun | Pending Home Sales MoM | May | -0.5% | 0.0% |
| 30-Jun | Personal Income | May | 0.4% | 0.4% |
| 30-Jun | Personal Spending | May | 0.2% | 0.8% |
| 30-Jun | Real Personal Spending | May | 0.1% | 0.5% |
| 30-Jun | PCE Deflator YoY | May | 3.8% | 4.4% |
| 30-Jun | PCE Core Deflator YoY | May | 4.7% | 4.7% |
| 30-Jun | MNI Chicago PMI | Jun | 44.0 | 40.4 |
| 30-Jun | UM (Go MSU) Consumer Sentiment | Jun | 63.9 | 63.9 |
| 30-Jun | UM (Go MSU) Current Expectations | Jun | N/A | 68.0 |
| 30-Jun | UM (Go MSU) Expectations | Jun | N/A | 61.3 |
| 30-Jun | UM (Go MSU) 1-yr inflation | Jun | N/A | 3.3% |
| 30-Jun | UM (Go MSU) 5- to 10-yr inflation | Jun | N/A | 3.0% |
Mark Frears is an Investment Advisor, Executive Vice President, at Texas Capital Bank Private Wealth Advisors. He holds a Bachelor of Science from The University of Washington, and an MBA from University of Texas – Dallas.
The contents of this article are subject to the terms and conditions available here.