Risk — Week of July 10, 2023

Essential Economics
— Mark Frears
Risk On, Risk Off
Not quite wax on, wax off, but you get the picture. How much risk do you take in your daily life? Things like jumping out of planes, climbing El Cap, jumping on a trampoline, or driving to work have different degrees of risk.
Investors and markets are driven by appetite for risk and perceived risk. In general, buying equities is considered “risk on” and purchasing bonds “risk off.”
Equities
As equities are shares in individual companies, they have more risk. You can mitigate some of this risk by investing in mutual funds or exchange trade funds (ETF) as they invest in a basket of companies. One of the primary measures of equity risk/volatility is the VIX Index. This incorporates the option quotes on the S&P 500 Index, and, as you can see below, at a level of 14, this is below long-term average and not elevated.
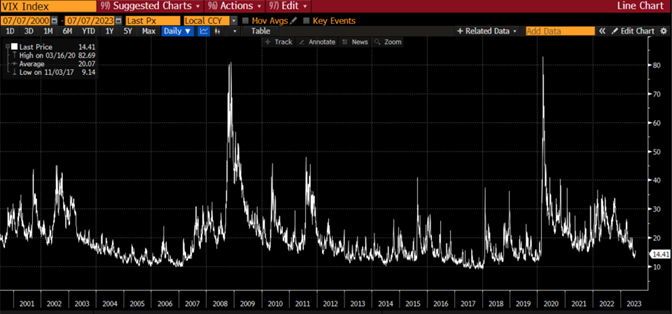
Source: Bloomberg
While stock market indexes showed a strong second-quarter, the concern is that only a handful of companies’ performance is driving the upswing. That should add to the volatility/fear/risk in the market, yet the VIX seems to be ignoring that. You would see this ramping up if a recession was approaching.
Bonds
As bonds are debt, and not ownership, they carry less risk. Therefore, in uncertainty or periods of economic weakness, investors would buy bonds. A bond, whether obligation of the U.S. Treasury, a mortgage-backed security, a municipality or a corporation, will pay a known payment or rate. If you pay close attention to the quality, or creditability of the issuer, you will receive a payment. Therefore, less risk.
There are a couple of indicators of risk in the bond market. First, the shape of the yield curve, or how much you are paid at different points in the future. Theoretically, if you lend money to a company for 10 years, they should pay a higher rate than if you gave it to them for a year, as they have it longer. Currently the yield curve is inverted!
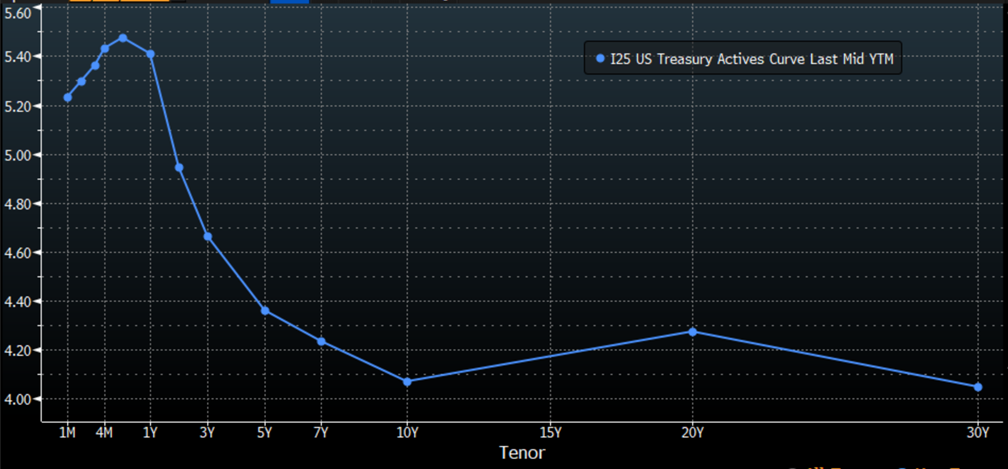
Source: Bloomberg
As you can see above, short-term rates are higher than long-term rates. Historically, an inverted curve portrays a coming recession. Bottom line, investors think short-term rates will drop to be more in line with a positively sloping curve. This also shows the investor’s view on inflation. This curve shows inflation is expected to drop, otherwise lenders would require to be paid more for longer-term obligations.
A second risk indicator from the bond market is tied to credit quality of the issuer. High-yield bonds pay more for a reason! They are also high risk. The spread, or number of basis points (bp), above a risk-free bond, like a U.S. Treasury, is a great indicator of coming risk. If the spread is widening, or growing, the market believes that the economy is worsening. Currently this spread is 415 bps, well below historical pre-recession levels of 590bp, but this is something to continue to watch.
Individuals
Last week we talked about consumer confidence, and how it seems to be improving. People will take more risk when they are confident. One of the main components of that confidence is whether they have a job, and feel that if they lost it, could readily find another. Last Friday we had the monthly Non-farm Payroll release, showing that the employers added 209,000 jobs in June. As you can see below, we have been above 200,000 going back some time.
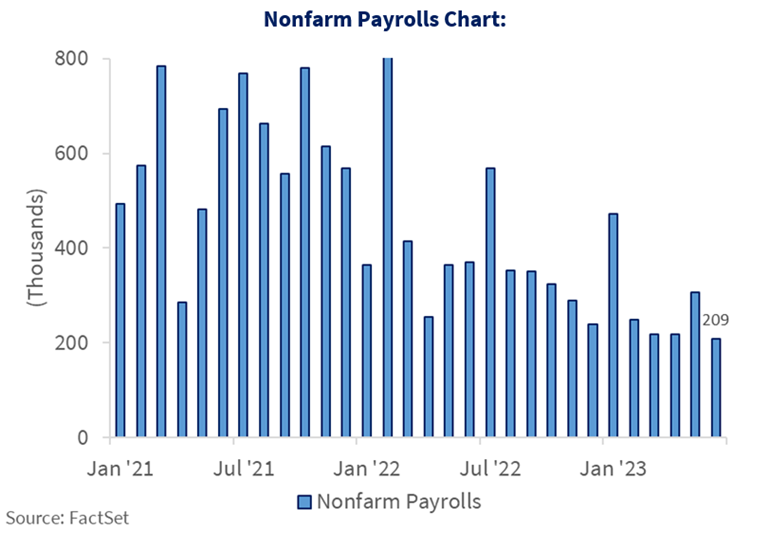
Source: FactSet
While this may not make you or me take up free climbing, it may embolden us to make major purchases, book more vacations and take more risk in our investments.
Our houses, as our largest purchase, also play into this risk profile. If we bought a house when mortgage rates were low, we are feeling pretty good about that as rates have risen. More people are staying in their homes longer as prices are still high and mortgage rates make it even more expensive. Most of the improving housing market you are hearing about is in new home production.
Bottom line, as an individual, you need the appropriate amount of risk in your life, or you can’t sleep at night. Given the current strong job market, the income side of your ledger should be good, but perhaps there are changes you can make on the liability side to help you get more comfortable. Inflation is also not helping right now, but we are moving in the right direction.
Overall
While usual equity metrics are not showing stress, the inverted yield curve continues to tell us something is coming. Releases like payrolls, housing market and consumer spending still show an economy that is ticking right along. We are seeing some cracks, like higher underemployment rate, potential declining service sector and rising consumer credit.
The one thing that everyone watches is the Federal Reserve Bank. They don’t like a strong economy when inflation is still above their long-term target. Therefore, they will hike short-term rates again on July 26, and could continue to hike if they don’t see a slowing economy helping them cool down prices. The risk here is they go too far and choke off economic growth. Chances are high they will. That is a risk we can’t control, so pay attention.
Economic releases
Last week saw strong employment numbers, along with above expectations readings from the ISM Services, and cars sold. ISM Manufacturing was weaker, and the available jobs number declined.
This week, we have the very important Consumer Price Index, Consumer Credit, Small Business Optimism and lesser releases like Producer Price Index. See below for details.
Wrap-Up
The markets are a great place to watch for risk indicators, as these are real dollars making choices every day. As you take into consideration all the elements of risk before you make a decision, use the markets’ knowledge to assist you.
| Upcoming Economic Releases: | Period | Expected | Previous | |
|---|---|---|---|---|
| 10-Jul | Wholesale Inventories MoM | May | -0.1% | -0.1% |
| 10-Jul | Consumer Credit | May | $20.000B | $23.010 B |
| 11-Jul | NFIB Small Business Optimism | Jun | 89.9 | 89.4 |
| 12-Jul | Consumer Price Index MoM | Jun | 0.3% | 0.1% |
| 12-Jul | CPI ex Food & Energy MoM | Jun | 0.3% | 0.4% |
| 12-Jul | Consumer Price Index YoY | Jun | 3.1% | 4.0% |
| 12-Jul | CPI ex Food & Energy YoY | Jun | 5.0% | 5.3% |
| 12-Jul | Real Avg Hourly Earnings YoY | Jun | N/A | 0.2% |
| 12-Jul | Real Avg Weekly Earnings YoY | Jun | N/A | -0.7% |
| 12-Jul | Fed releases Beige Book in preparation for July 26 FOMC meeting | |||
| 13-Jul | Producer Price Index MoM | Jun | 0.2% | -0.3% |
| 13-Jul | PPI ex Food & Energy MoM | Jun | 0.2% | 0.2% |
| 13-Jul | Producer Price Index YoY | Jun | 0.4% | 1.1% |
| 13-Jul | PPI ex Food & Energy YoY | Jun | 2.6% | 2.8% |
| 13-Jul | Initial Jobless Claims | 8-Jul | 250,000 | 248,000 |
| 13-Jul | Continuing Claims | 1-Jul | 1,720,000 | 1,720,000 |
| 14-Jul | Import Price Index MoM | Jun | -0.1% | -0.6% |
| 14-Jul | Export Price Index MoM | Jun | 0.0% | -1.9% |
| 14-Jul | UM (Go MSU) Consumer Sentiment | Jul | 65.5 | 64.4 |
| 14-Jul | UM (Go MSU) Current Conditions | Jul | N/A | 69.0 |
| 14-Jul | UM (Go MSU) Expectations | Jul | N/A | 61.5 |
| 14-Jul | UM (Go MSU) 1-yr inflation | Jul | 3.1% | 3.3% |
| 14-Jul | UM (Go MSU) 5- to 10-yr inflation | Jul | 3.0% | 3.0% |
Mark Frears is an Investment Advisor, Executive Vice President, at Texas Capital Bank Private Wealth Advisors. He holds a Bachelor of Science from The University of Washington, and an MBA from University of Texas – Dallas.
The contents of this article are subject to the terms and conditions available here.