How do you see it?! — Week of January 29, 2024

Essential Economics
— Mark Frears
Perspective
We have had a few days of rain here lately in Texas. Some would look at this with discouragement, as in crazy drivers and cloudy days. It’s not Seattle! Others would take the view that rain will fill the reservoirs, and we will hopefully have enough water to fight the summer heat. There are always different perspectives on the same event/issue.
Inflation has been top of mind for individuals, corporations and policymakers since the pandemic. The strain of higher prices on goods/services weighs heavily on all aspects of the economy. There are two primary measurements of inflation: CPI and PCE.
CPI
The most common view/measurement of inflation is the Consumer Price Index (CPI). This metric measures the overall change in consumer prices, based on a representative basket of goods and services over time. This is based on a survey of 80,000 price quotes and housing rents that are used to estimate the change in shelter costs. Housing accounts for about a third of CPI.
You will see this used for cost-of-living adjustments for social security. In addition, it is quoted without food and energy components in order to take out those more volatile sectors. The chart below shows that year-over-year change in the CPI going back to 2000.
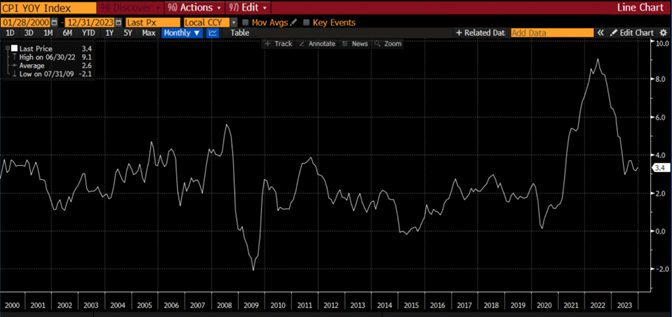
Source: Bloomberg
The average for this period is 2.6%, and the high was 9.1% on June 30, 2022. The Federal Reserve’s inflation target is 2%. The most recent measurement of 3.4% is still a way from 2%, and there has been some slowing of the downward trend.
PCE
The metric cited by the Federal Open Market Committee (FOMC) is the Personal Consumption Expenditure (PCE). This measures consumer spending, on durable and non-durable goods and services. The FOMC updates their forecast for this measurement on a quarterly basis, giving the markets an idea of their forward view. As you can see below, this year-over-year metric is not as volatile as the CPI.
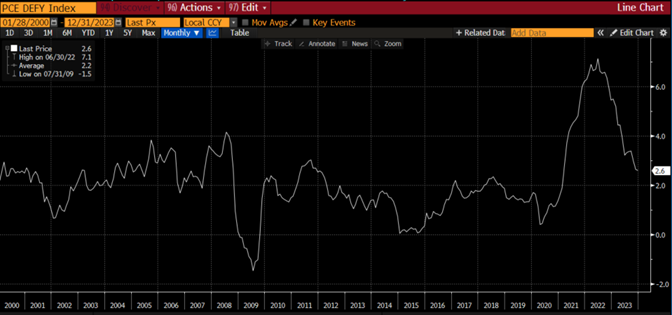
Source: Bloomberg
The average for this period is 2.2%, and the high was 7.1% on June 30, 2022. While the 2.6% current measurement is a great improvement, we are not yet to the Fed’s target of 2%.
Differences
As you can see below, these two measures may track each other but are not the same.
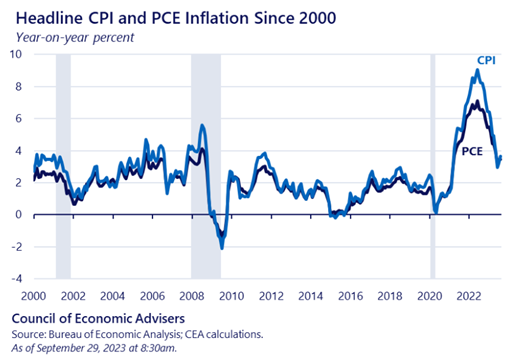
Source: Bureau of Economic Analysis
There are four sources of differences between these two important metrics. One, they use different formulas with CPI based on averages and PCE taking into consideration substitution effects. Two, the relative weights assigned to CPI are based on the Consumer Expenditure Survey, a household measurement. The PCE relative weights are derived from business surveys, such as the Census Bureau’s annual and monthly retail trade surveys. Third, the scope is different for each. CPI uses the change in out-of-pocket expenditures for all urban households. The PCE measures the change in goods and services consumed by all households and nonprofit organizations serving households. The fourth difference is a mix of seasonal adjustments, price differences and methodical differences, such as how airline fares are calculated.
Both of these are valid, solid measurements of inflation; they just do it slightly differently. As you can see in the chart above, CPI usually runs slightly higher than PCE.
FOMC
While CPI is used for social security and other inflation adjustments, PCE is the focus of the FOMC, and therefore we should pay attention to it. The most recent published target for December 2024 PCE year over year is 2.4% going down to 2.0% by year end 2026. As you can see above, the December 2023 metric came in at 2.6%. Therefore, if prices continue to fall this year, they should be able to meet that target.
This is giving fuel to the speculation for the target Fed Funds rate to be cut by 1.25% by year end. The FOMC’s average expected rate for December 2024 shows three cuts, or 0.75%. We will not receive a new estimate from the FOMC at this week’s meeting but will have to wait until March 20 to see that.
Markets view lower rates as more stimulative to the economy, and that is at least partly to explain the recent equity rally. Soft landing, or no recession, scenarios abound.
One thing that may give the Fed pause in lowering rates is looking at the supply side of the inflation equation. The Fed can only influence the demand side by raising short-term rates and sending a message of tightening money supply. This should cause the consumer to slow spending activity and bring inflation down. On the supply side, less demand should cause suppliers to lower prices to move their inventory. The current issue we are seeing is that supply chain constraints are starting to show up due to almost no Suez Canal access. This could cause prices to rise and keep the Fed on hold for a bit longer.
As far as the consumer is concerned, they still seem to be spending, potentially keeping prices higher. Spending on goods has slowed down, but demand for services is going the opposite way. As you can see below in the PCE Core Services Price Index, December’s reading of 3.3% is not what the Fed wants to see.
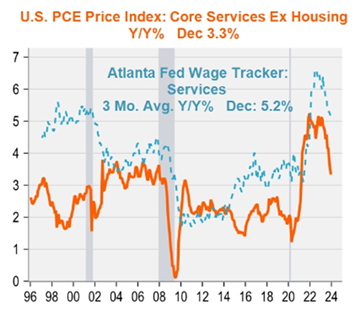
Source: Piper Sandler
Contributing to this higher Core Services Index are wages, with the Atlanta Fed Wage Tracker for Services still running at 5.5%.
Looking at longer-term trends can be helpful as well. The three- and six-month annualized core PCE came in below 2%. As you can also see below, housing is still running hot, so we will keep an eye on that sector.
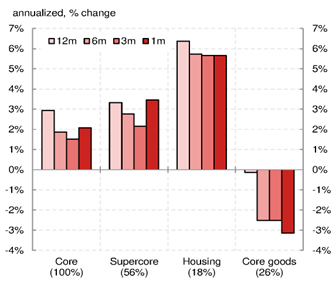
Source: Nomura Global Research
Inflation is trending lower, but concern in the services sector, as well as potential supply constraints, could cause the Fed to stay on hold longer than what the market would like.
Economic releases
Last week saw strong economic metrics in Q4 GDP, Durable Goods, Personal Income and Spending.
This week’s calendar will have a focus on the FOMC meeting announcement and press conference on Wednesday. We also have employment data in JOLTS, ADP and nonfarm payroll. Big week. See below for details.
Wrap-up
Your perspective can make a material difference in your life. Keeping a “glass half full” view will change how you see things! On the inflation front, we will be looking for improvement no matter the measurement.
| Upcoming Economic Releases: | Period | Expected | Previous | |
|---|---|---|---|---|
| 29-Jan | Dallas Fed Manuf Activity | Jan | (11.8) | (9.3) |
|
|
| ||
| 30-Jan | FHFA House Price Index MoM | Nov | 0.3% | 0.3% |
| 30-Jan | S&P CoreLogic 20-City YoY NSA | Nov | N/A | 4.87% |
| 30-Jan | Conf Board Consumer Confidence | Jan | 114.0 | 110.7 |
| 30-Jan | Conf Board Present Situation | Jan | N/A | 148.5 |
| 30-Jan | Conf Board Expectations | Jan | N/A | 85.6 |
| 30-Jan | JOLTS Job Openings | Dec | 8,709,000 | 8,790,000 |
| 30-Jan | Dallas Fed Services Activity | Jan | N/A | (8.7) |
|
|
| ||
| 31-Jan | ADP Employment Change | Jan | 148,000 | 164,000 |
| 31-Jan | Employment Cost Index | Q4 | 1.0% | 1.1% |
| 31-Jan | MNI Chicago PMI | Jan | 48.0 | 46.9 |
| 31-Jan | FOMC Rate Decision (Upper Bound) | 1p CT | 5.50% | 5.50% |
| 31-Jan | FOMC Rate Decision (Lower Bound) | 1p CT | 5.25% | 5.25% |
|
|
| ||
| 1-Feb | Challenger Job Cuts YoY | Jan | N/A | -20.2% |
| 1-Feb | Nonfarm Productivity | Q4 P | 2.3% | 5.2% |
| 1-Feb | Unit Labor Costs | Q4 P | 1.5% | -1.2% |
| 1-Feb | Initial Jobless Claims | 27-Jan | 1,843,000 | 214,000 |
| 1-Feb | Continuing Claims | 20-Jan | 1,840,000 | 1,833,000 |
| 1-Feb | Construction Spending MoM | Dec | 0.5% | 0.4% |
| 1-Feb | ISM Manufacturing Index | Jan | 47.0 | 47.4 |
| 1-Feb | ISM Manufacturing Prices Paid | Jan | 45.8 | 45.2 |
| 1-Feb | ISM Manufacturing Employment | Jan | N/A | 48.1 |
| 1-Feb | ISM Manufacturing New Orders | Jan | N/A | 47.1 |
| 1-Feb | Ward’s Total Vehicle Sales | Jan | 15,700,000 | 15,830,000 |
|
|
| ||
| 2-Feb | Change in Nonfarm Payrolls | Jan | 180,000 | 216,000 |
| 2-Feb | Change in Private Payrolls | Jan | 148,000 | 164,000 |
| 2-Feb | Unemployment Rate | Jan | 3.8% | 3.7% |
| 2-Feb | Avg Hourly Earnings MoM | Jan | 0.3% | 0.4% |
| 2-Feb | Avg Hourly Earnings YoY | Jan | 4.1% | 4.1% |
| 2-Feb | Labor Force Participation Rate | Jan | 62.6% | 62.5% |
| 2-Feb | Underemployment Rate | Jan | N/A | 7.1% |
| 2-Feb | UM Consumer Sentiment | Jan F | 79.0 | 78.8 |
| 2-Feb | UM Current Conditions | Jan F | N/A | 83.3 |
| 2-Feb | UM Expectations | Jan F | N/A | 75.9 |
| 2-Feb | UM 1-yr inflation | Jan F | N/A | 2.9% |
| 2-Feb | UM 5-10-yr inflation | Jan F | N/A | 2.8% |
| 2-Feb | Factory Orders | Dec | 0.2% | 2.6% |
| 2-Feb | Factory Orders ex Transportation | Dec | N/A | 0.1% |
Mark Frears is a Senior Investment Advisor, Managing Director, at Texas Capital Bank Private Wealth Advisors. He holds a Bachelor of Science from The University of Washington, and an MBA from University of Texas – Dallas.
The contents of this article are subject to the terms and conditions available here.