Interest rates— Week of February 20, 2023

Essential Economics
— Mark Frears
No longer zero
What does it feel like to have zero of something? Zero savings, vehicles, friends or jobs would not be good. Zero debt, bills, aches and pains, or uncompleted tasks would be good. There is a negative connotation to zero, or nothing, but that is not always true. Interest rates of zero are great for borrowers and terrible for lenders.
Short-term
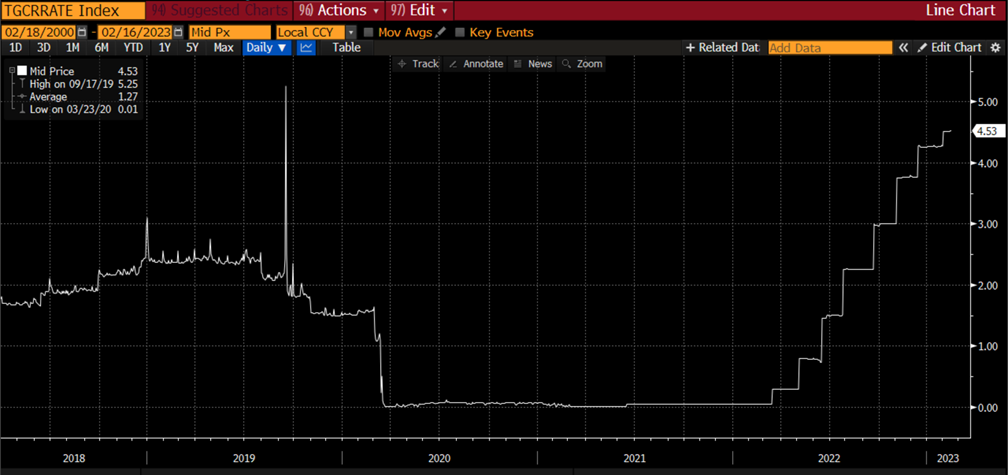
Rates paid/received for a short period of time are driven by the Fed Funds (FF) market, or where the Federal Open Market Committee (FOMC) sets the target rate for banks to trade funds. It may be hard to believe, but less than a year ago, this benchmark was essentially zero. As you can see below, it currently is 4.53% (between the target of 4.50 to 4.75%).
Source: Bloomberg
This rate stayed at zero for almost two years, keeping borrowing costs low and giving no incentive for holding onto cash. We went through the pandemic during this time and the FOMC’s concern was stimulating the economy, due to the impact of the shutdown. As inflation bubbled up out of this environment, the often-asked question is whether they left rates low too long.
Long-term
Further out the curve, while the Fed is still a factor, the driving force is the inflation or recession expectation. If I am going to lend or borrow money for 10 years, what rate will I demand, given the view of the future 10 years out?
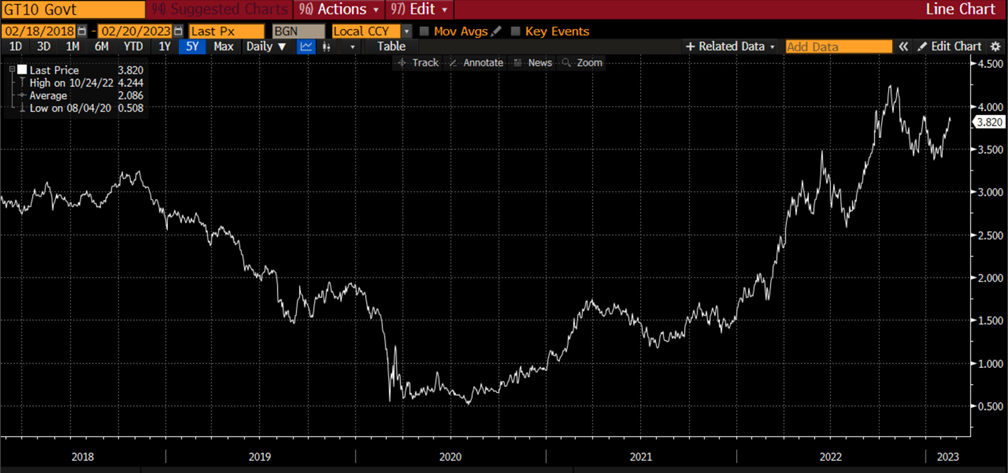
If you look at the 10-year U.S. Treasury (UST) note’s rate going back to 2018 below, you can see the steady rise starting in 2020 as inflation concerns ramped up.
Source: Bloomberg
After the peak in October 2022, when we saw inflation indicators peaking, long rates started to fall. While we continue to see these indicators come down on a year-over-year basis, the tight labor market has caused the long-term rates to stay up at elevated levels. This chart shows the uncertainty as to the future in the inflation or recession expectations.
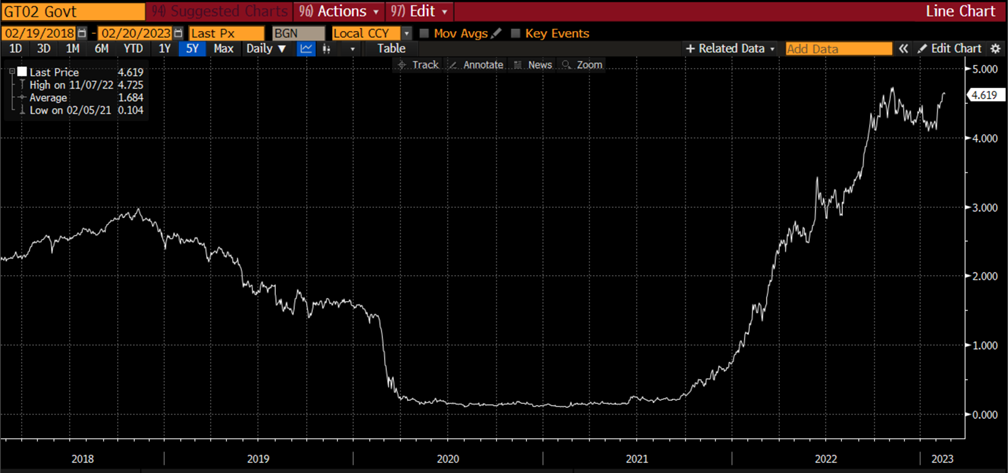
If we look at the shorter end of the UST curve, as in the two-year note below, we see a pattern more closely following the FF rate, as it is more influenced by the overnight target rate. The downward trend has been halted as labor market tightness and FOMC talking heads make the case for the inflation fight to continue and short-term rates to remain higher longer.
Source: Bloomberg
Combination and comparison
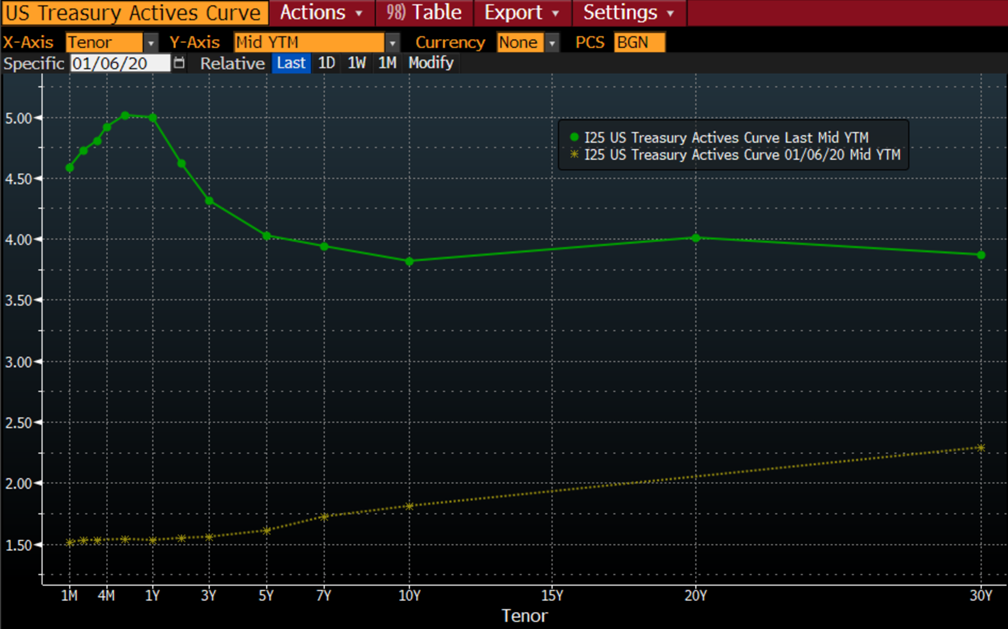
We have looked at several interest rates, but markets like to see the bigger picture as well. The yield curve is a view of rates across multiple maturities/tenors. The UST curve is below, the top/dark green curve is the current curve, and the lower/yellow curve is as of January 2020.
Source: Bloomberg
There are several takeaways from this. First, interest rates now are higher than 2020 as inflation has reared its ugly head. Second, the 2020 curve has a positive slope, indicative of a healthy economy, although the lower rates and flatness show a less robust view. Third, the current curve is inverted with short-term rates higher than longer rates. This portrays a coming recession, or economic slowdown.
The UST curve from three-month to 10-year is the most reliable indicator of a coming recession. The chart below shows this curve going back to 2018. As you can see, it dipped into negative territory in 2019, prior to the pandemic, when there was uncertainty as to the direction of the economy. This was not a long-term effect.
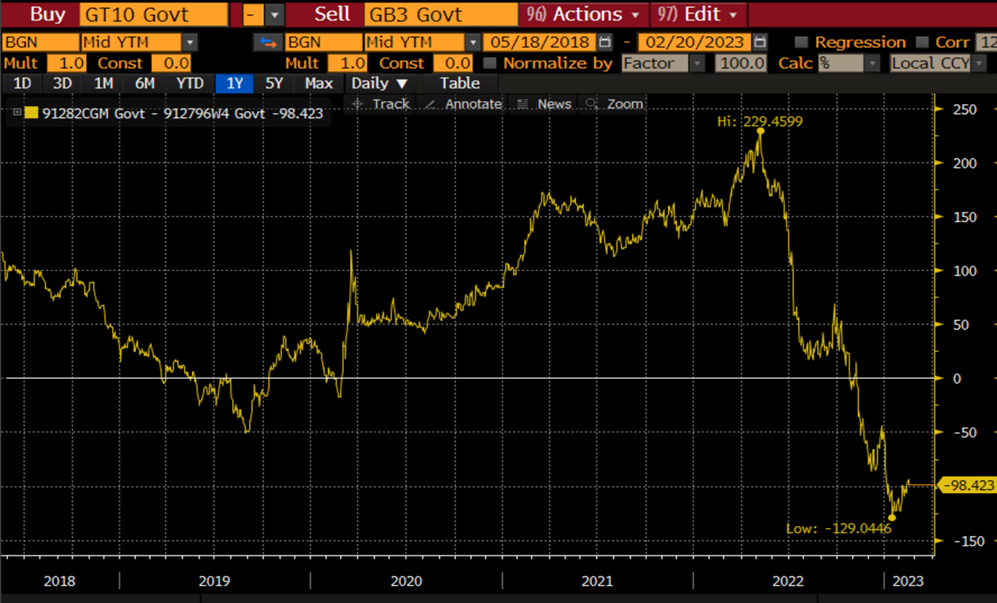
Source: Bloomberg
The more recent inversion, starting in November 2022, is more of a concern. The chart below gives us a historical view of past inversions and the timing of the following recession.
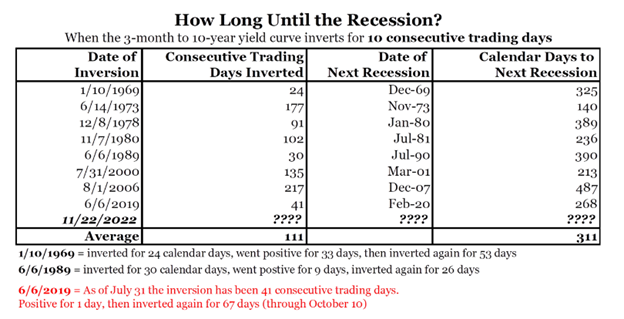
Source: Bianco Research
We have been inverted for over 10 consecutive trading days; therefore, this chart would show us we have a recession coming. Steve Orr has named this the “Most Anticipated Recession Ever” and based on the average number of days, we will be anticipating this until October 2023. Stay tuned.
Global
The inflation-recession quandary is not isolated to the U.S. as we have seen central banks around the world raising short-term rates in their own battles against inflation.
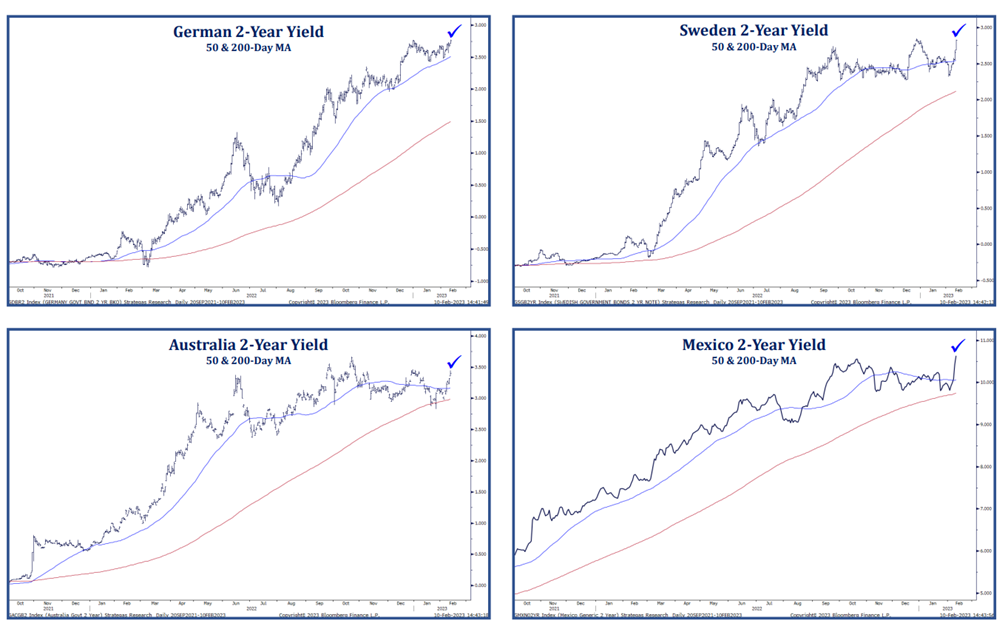
Source: Strategas Technical & Macro Research
Takeaway
Recent economic news has shown that the economy is doing just fine, even in the face of higher prices. The interest rate market is really on the only significant indicator showing a pending recession. The talk has turned from whether we will have a hard or soft landing, or no landing!
Wrap-up
We are a ways from zero now in the interest rate environment, and that is not all bad. For people on fixed incomes, they are now able to earn something on their short-term cash. Also, somewhat higher prices can cause evaluations on what we really need as well as create competition in the marketplace. On a historical perspective we are not in a high interest rate environment, and some would call this the Goldilocks days!
| Upcoming Economic Releases: | Period | Expected | Previous | |
|---|---|---|---|---|
| 21-Feb | Philadelphia Fed Non-Manuf Activty | Feb | N/A | (6.5) |
| 21-Feb | S&P Global US Manufacturing PMI | Feb | 47.4 | 46.9 |
| 21-Feb | S&P Global US Services PMI | Feb | 47.3 | 46.8 |
| 21-Feb | S&P Global US Composite PMI | Feb | 47.5 | 46.8 |
| 21-Feb | Existing Home Sales | Jan | 4,100,000 | 4,020,000 |
| 21-Feb | Existing Home Sales MoM | Jan | 2.0% | -1.5% |
| 22-Feb | FOMC Meeting Minutes from Jan 31-Feb 1 released at 1:00 p.m. CT | |||
| 23-Feb | Chicago Fed Nat'l Activity Index | Jan | 0.00 | (0.49) |
| 23-Feb | GDP Annualized QoQ | Q4 | 2.9% | 2.9% |
| 23-Feb | Personal Consumption | Q4 | 2.0% | 2.1% |
| 23-Feb | Initial Jobless Claims | 18-Feb | 199,000 | 194,000 |
| 23-Feb | Continuing Claims | 11-Feb | 1,701,000 | 1,696,000 |
| 23-Feb | KC Fed Manufacturing Activity | Feb | (2) | (1) |
| 24-Feb | Personal Income | Jan | 1.1% | 0.2% |
| 24-Feb | Personal Spending | Jan | 1.3% | -0.2% |
| 24-Feb | Real Personal Spending | Jan | 1.0% | -0.3% |
| 24-Feb | PCE Deflator YoY | Jan | 5.0% | 5.0% |
| 24-Feb | PCE Core Deflator YoY | Jan | 4.3% | 4.4% |
| 24-Feb | New Home Sales | Jan | 620,000 | 616,000 |
| 24-Feb | New Home Sales MoM | Jan | 0.7% | 2.3% |
| 24-Feb | UM (Go MSU) Consumer Sentiment | Feb | 66.4 | 66.4 |
| 24-Feb | UM (Go MSU) Current Expectations | Feb | N/A | 72.6 |
| 24-Feb | UM (Go MSU) Expectations | Feb | N/A | 62.3 |
| 24-Feb | UM (Go MSU) 1-yr inflation | Feb | N/A | 4.2% |
| 24-Feb | UM (Go MSU) 5- to 10-yr inflation | Feb | N/A | 2.9% |
| 24-Feb | KC Fed Services Activity | Feb | N/A | (11) |
Mark Frears is an Investment Advisor, Executive Vice President, at Texas Capital Bank Private Wealth Advisors. He holds a Bachelor of Science from The University of Washington, and an MBA from University of Texas – Dallas.
The contents of this article are subject to the terms and conditions available here.