Stuff vs Time — Week of August 7, 2023

Essential Economics
— Mark Frears
Follow the Money
One way to look at your spending is to separate it by whether you receive a tangible item for your money, or an experience. It used to be all about the stuff and is now more about the journey. As the kids are out of the house now, we appreciate the times we have together, whether at one of their locations or out on a trip together. Much rather spend the money on that. Probably a sign of age!
The service sector of the economy has gained visibility in the post-COVID world. How does this category impact hiring, inflation and consumer spending?
Jobs
As the service sector is approximately three-quarters of our economy, attention must be paid to hiring. The most recent nonfarm payroll showed a slightly lower than expected number of jobs added last month, and there are some nuances related to services. As you can see below, the Healthcare area was the largest contributor to the 187,000 jobs added in July.
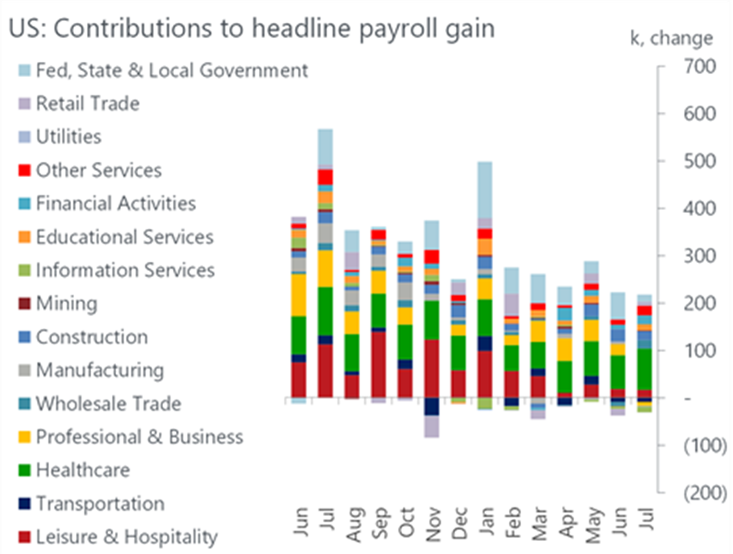
Source: Oxford Economics/Haver Analytics
Given the aging population and the number of healthcare workers who left the workforce post-pandemic, there will be continued demand for these workers.
The Leisure and Hospitality sector accounted for 22% of job gains from January 2022 to June 2023. We have started to see a slowdown here, portraying continued slowing in overall hiring.
A leading indicator from payroll is temporary employment. As the economy slows, employers pull back on part-time workers. As you can see below, in July this was down 22,000 on a month-over-month basis and down 4.7% on a year-over-year basis.
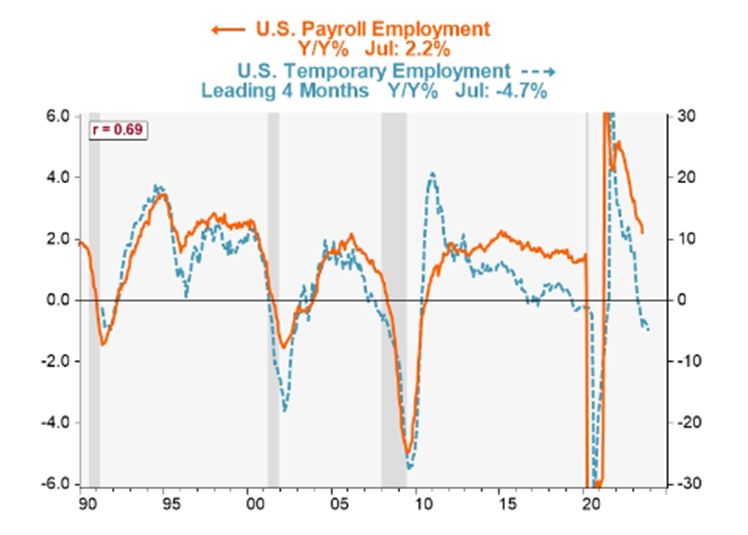
Source: Piper Sandler Economics/BLS/Haver
Inflation
The latest Consumer Price Index (CPI) will be out next week and given the focus on the Fed’s battle with price stability, this will be closely watched. This “basket of goods and services” that are watched for price changes is approximately 60% weighted to services. Therefore, the pricing of airfares, hotels, medical care and rental cars, to name a few, is so important to the inflation picture.
As you might imagine, the largest cost for service providers is wages. The good news for employers was that during the second quarter, compensation costs increased at the slowest pace in two years. While this is headed in the right direction, the 4.6% year-over-year increase is still above the long-term rate that will support a 2% inflation target.
One thing that mitigates the higher cost of employees is if they are producing more or being more efficient. For the second quarter, nonfarm productivity was up a surprising 3.7% on a quarter-over-quarter basis. Unfortunately, this was driven by weakness in the labor market and not more output growth. This is an area to keep an eye on in the future, to see if this can offset higher wages.
Spending
As we know, the consumer accounts for two-thirds of Gross Domestic Product (GDP), or economic activity. So, with the consumer, not just our household, leaning more toward experiences, the service sector could become even more important. Currently this makes up over 75% of GDP and, as you can see below in this summary of 2022, covers a wide variety of industries.
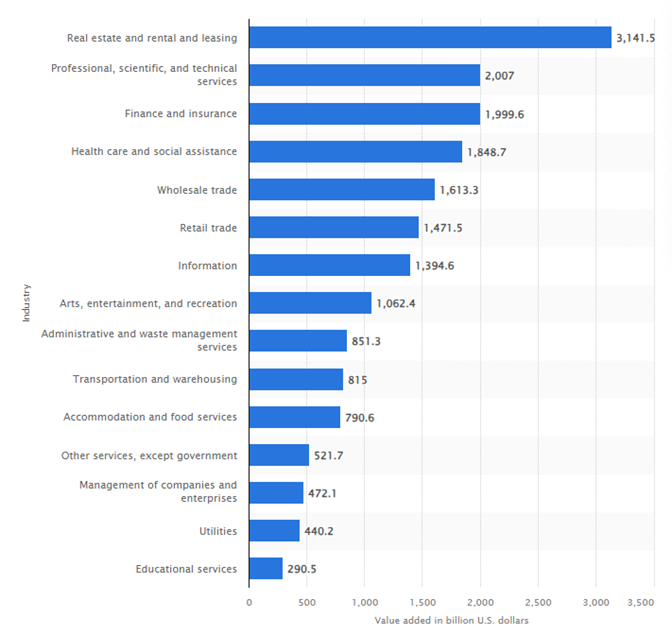
Source: Statisa.com
Index update
The Institute of Supply Management (ISM) Services Index came out last week, dropping from 53.9 to 52.7 for July. The small decline last month could be signaling a slowdown here, but the index (see below) remains above 50.0, indicating growth continuing.
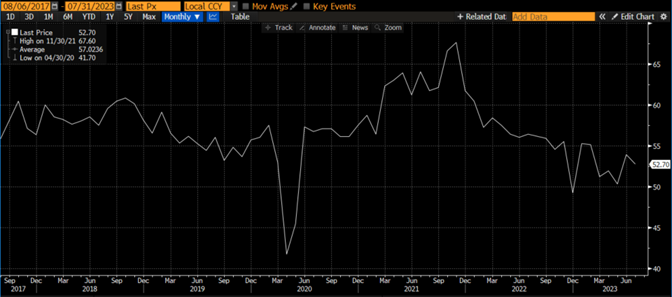
Source: Bloomberg
The components of the index showed a mixed picture. Business Activity fell 2.1 to 57.1, but still showed strong in Accommodations and Food Services areas. These subcategories’ strength shows discretionary spending is still doing very well. The Employment section was about the same as June and prices paid was up 2.7, indicating wage costs are still an issue. New Orders are the forward-looking portion of the metric, and this rose by 0.5 to 55.0. Beneath that, 13 of 18 industries showed higher orders, the same as June.
Economic releases
The payroll numbers last week showed a labor market that is still solid. Economists and talking heads attempted to show some signs of weakness so that the recent “no recession” and Fed done with rate hikes scenarios had more merit.
This week is all about inflation with CPI and PPI out. In addition, we have consumer credit and sentiment numbers from the consumer and small business. See below for details.
Wrap-Up
Our family’s trend to more experiences is not an isolated phenomenon. Therefore, more focus will continue to be on the service sector for guidance as to the economic future. What should I try next?!
| Upcoming Economic Releases: | Period | Expected | Previous | |
|---|---|---|---|---|
| 7-Aug | Consumer Credit | Jun | $13.550B | $7.240 B |
| 8-Aug | NFIB Small Business Optimism | Jul | 90.5 | 91.0 |
| 10-Aug | Consumer Price Index MoM | Jul | 0.2% | 0.2% |
| 10-Aug | CPI ex Food & Energy MoM | Jul | 0.2% | 0.2% |
| 10-Aug | Consumer Price Index YoY | Jul | 3.3% | 3.0% |
| 10-Aug | CPI ex Food & Energy YoY | Jul | 4.8% | 4.8% |
| 10-Aug | Initial Jobless Claims | 5-Aug | 230,000 | 227,000 |
| 10-Aug | Continuing Claims | 29-Jul | N/A | 1,700,000 |
| 10-Aug | Real Avg Hourly Earnings YoY | Jul | N/A | 1.2% |
| 10-Aug | Real Avg Weekly Earnings YoY | Jul | N/A | 0.6% |
| 11-Aug | Producer Price Index MoM | Jul | 0.2% | 0.1% |
| 11-Aug | PPI ex Food & Energy MoM | Jul | 0.2% | 0.1% |
| 11-Aug | Producer Price Index YoY | Jul | 0.7% | 0.1% |
| 11-Aug | PPI ex Food & Energy YoY | Jul | 2.3% | 2.4% |
| 11-Aug | UM (Go MSU) Consumer Sentiment | Aug | 71.5 | 71.6 |
| 11-Aug | UM (Go MSU) Current Conditions | Aug | 76.8 | 76.6 |
| 11-Aug | UM (Go MSU) Expectations | Aug | 66.5 | 68.3 |
| 11-Aug | UM (Go MSU) 1-yr inflation | Aug | 3.4% | 3.4% |
| 11-Aug | UM (Go MSU) 5- to 10-yr inflation | Aug | 3.0% | 3.0% |
Mark Frears is an Investment Advisor, Executive Vice President, at Texas Capital Bank Private Wealth Advisors. He holds a Bachelor of Science from The University of Washington, and an MBA from University of Texas – Dallas.
The contents of this article are subject to the terms and conditions available here.