Spring has sprung — Week of April 17, 2023

Essential Economics
— Mark Frears
Spring
Over Easter weekend, we headed up to northern Wisconsin to see our son and his wife. Amazing the difference in springtime weather in various parts of the country. We left Dallas with the bluebonnets blooming, and the low the night we got to Eagle River was 8 degrees! We did see the snowbanks start the melting process a few days later. Spring is here and things are changing and growing. Is anything changing in the economy?
Inflation
The cost of goods and services continues to eat into budgets at a higher level than two years ago, when the year-over-year Consumer Price Index (CPI) headed north of 2%. Last week, while improved over the prior month, inflation was still running at 5%.
The core CPI (excluding Food & Energy) on a year-over-year basis is not showing the same level of improvement. As you can see below, the most recent reading was 5.6%, up from 5.5% last month.
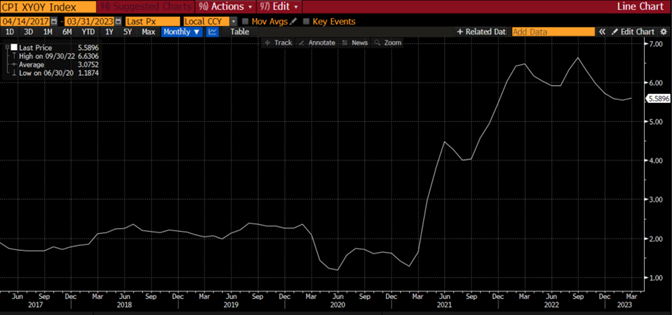
Source: Bloomberg
As you can see below, the stickiest components of inflation are food and core services.
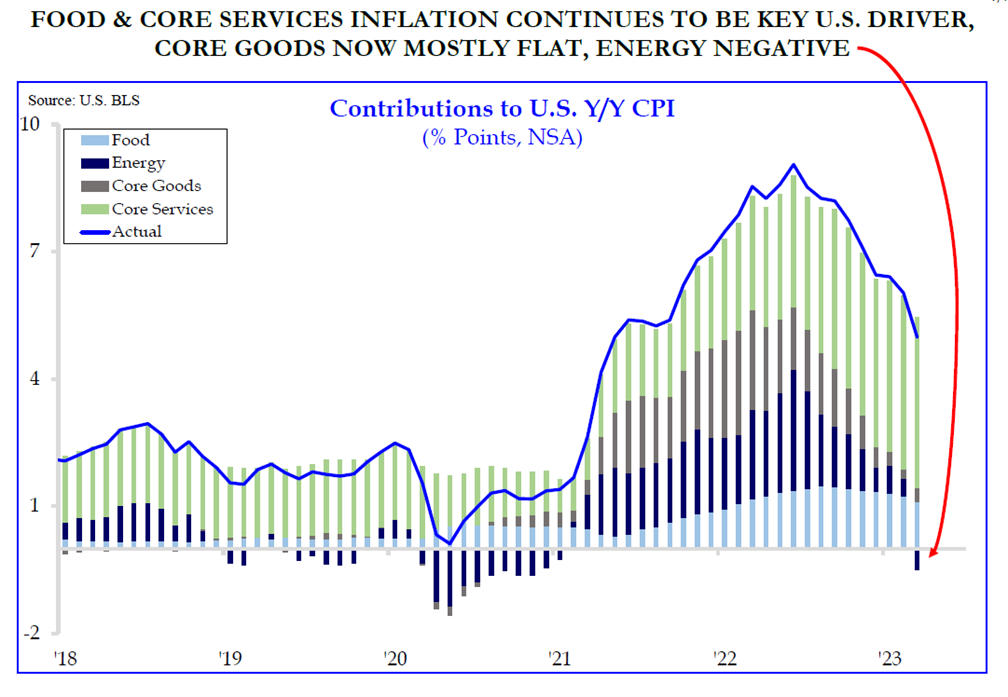
Source: Strategas Research
On the next level up the stream, the Producer Price Index (PPI) decreased on a month-over-month basis, as well as year-over-year basis. At 2.7%, it is significantly lower than CPI, yet the core PPI on a year-over-year basis is running 3.4%.
For both inflation measures, the impact of higher food and energy costs continues to plague the economy.
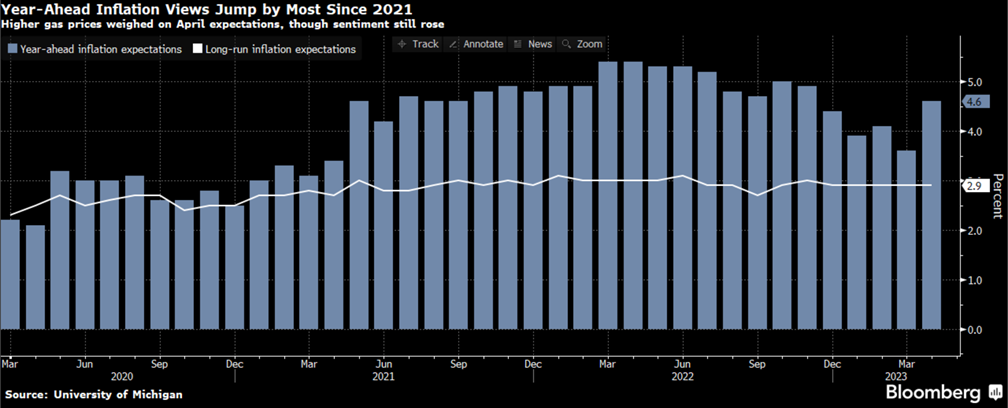
The University of Michigan Consumer Sentiment also has an inflation component. People weigh in on their inflation view for one year from now and five to 10 years in the future. The longer-term view stayed at 2.9% this month, but the near-term view jumped from 3.6% to 4.6%, the largest change in two years. (See below.)
So, while components of inflation are changing somewhat, we are still paying too much for goods and services.
Consumer
In the uncertain economic environment, consumers seem to be marching on, not materially modifying their behavior. This may be changing, as the Retail Sales release for March was negative for the second month in a row. (See below.) Food services spending, the proxy for discretionary outlays, was nearly flat on the month. This does not bode well for future spending. In addition, higher gasoline prices and harder to obtain credit could move us faster into a recession.
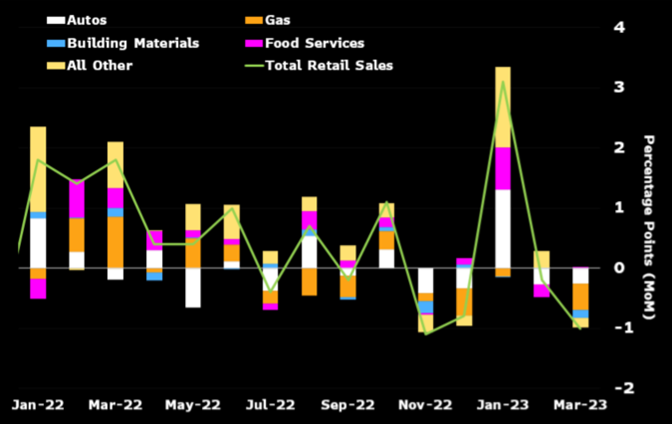
Source: Bloomberg
As you are not buying as much with your hard-earned dollars due to inflation, these numbers are weaker than the headline number.
The other measure of the consumer out this week was the University of Michigan Consumer Sentiment. As you can see below, there has been a positive trend since last June, but we are still quite a way from the 90 – 100 range.
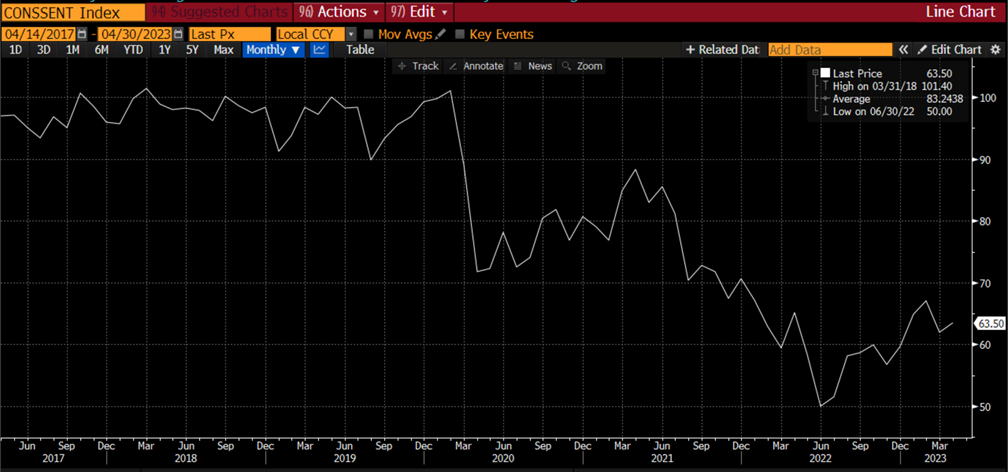
Source: Bloomberg
The Consumer Expectations Index portion focuses on how people view their financial conditions, and on the near and long-term expectations for the general public. This measure was higher than last month at 60.3, but still well below the strong economy range of 80 – 90.
Big picture
Has anything changed? The Fed talking heads are still talking pause and not pause. Inflation is improving, but still high. The consumer is still spending, getting less, but spending, nonetheless. The 10-year U.S. Treasury continues to bounce inside the 3.50% to 4% range. Equities are improving, but don’t have the breadth or underlying earnings to justify the strength. The most anticipated recession ever still looms on the horizon with the uncertainty as to the depth. Sounds like a broken record.
Economic releases
Next week we will get the most recent update on the housing market with NAHB index, Building Permits and Housing Starts, and Existing Home Sales. In addition, the Beige Book prepared for the May 2 – 3 FOMC meeting will be released, and the Leading Index is out on Friday. See below for more information.
Wrap-up
As the Byrds sang, “To everything turn, turn, turn; there is a season turn, turn, turn.” While spring has sprung, we have yet to see material changes in the economy.
| Upcoming Economic Releases: | Period | Expected | Previous | |
|---|---|---|---|---|
| 17-Apr | Empire Manufacturing | Apr | (18.0) | (24.6) |
| 17-Apr | NAHB Housing Market Index | Apr | 45 | 44 |
| 18-Apr | Building Permits | Mar | 1,450,000 | 1,524,000 |
| 18-Apr | Building Permits MoM | Mar | -6.5% | 13.8% |
| 18-Apr | Housing Starts | Mar | 1,400,000 | 1,450,000 |
| 18-Apr | Housing Starts MoM | Mar | -3.5% | 9.8% |
| 18-Apr | NY Fed Services Business Activity | Apr | N/A | (10.1) |
| 19-Apr | Federal Reserve releases Beige Book for May 2-3 FOMC Meeting | |||
| 20-Apr | Initial Jobless Claims | 15-Apr | 240,000 | 239,000 |
| 20-Apr | Continuing Claims | 8-Apr | 1,825,000 | 1,810,000 |
| 20-Apr | Philadelphia Fed Business Outlook | Apr | (19.7) | (23.2) |
| 20-Apr | Existing Home Sales | Mar | 4,500,000 | 4,580,000 |
| 20-Apr | Existing Home Sales MoM | Mar | -1.8% | 14.5% |
| 20-Apr | Leading Index | Mar | -0.7% | -0.3% |
| 21-Apr | S&P Global US Manufacturing PMI | Apr | 49.0 | 49.2 |
| 21-Apr | S&P Global US Services PMI | Apr | 51.5 | 52.6 |
| 21-Apr | S&P Global US Composite PMI | Apr | 51.2 | 52.3 |
Mark Frears is an Investment Advisor, Executive Vice President, at Texas Capital Bank Private Wealth Advisors. He holds a Bachelor of Science from The University of Washington, and an MBA from University of Texas – Dallas.
The contents of this article are subject to the terms and conditions available here.