More than a game show — Week of April 1, 2024

Essential Economics
— Mark Frears
Survey says
So, how are you feeling? Can you be more specific? Emotionally, physically, spiritually or financially? It has to be a thankless job getting people to respond. Keeping it short and providing incentives would be best for me. Do you remember the note passed in class, asking you if you liked someone? Check yes or no! That was a very telling survey.
In the land where the predicted recession has not shown up, inquiring minds want to know what the economic engine, the consumer, is thinking. What will they do next?
Conference Board
First out last week was the Conference Board’s survey of consumers’ current state and expectations. As you see below, both of these are treading water, struggling for direction.
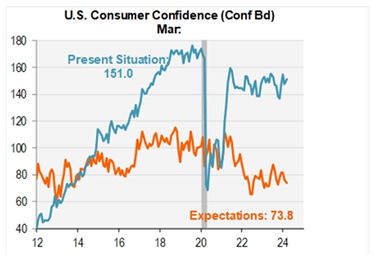
As you may recall, the Consumer Confidence Index is more influenced by employment and labor market conditions. Given the low unemployment rate, and apparently plentiful job opportunities, you would expect the expectations to be higher.
The other potential weakness seen in this release is the historically deeply negative spread between the expectations and present situation. This has signaled recession in the past, and, given this is the 35th straight month with a gap greater than 30 points, we would expect a recession in 1 to 3 years.
U of M
As I grew up in East Lansing, I don’t put much credence in anything that comes out of Ann Arbor, but we will take a look at the other major confidence survey. In the chart below, you can see this measure has been on an improving trend since hitting a bottom in June 2022.
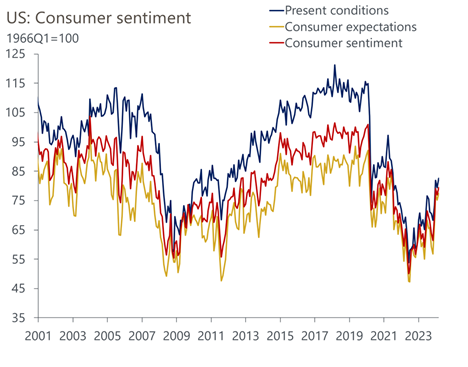
Source: Oxford Economics/Haver Analytics
The Michigan sentiment index has a greater emphasis on household finances and the impact of inflation. Given the stalled progress on the inflation fight, we may see this upward trend stall out.
Personal Consumption Expenditure (PCE) is the Fed’s inflation measure of choice, and the release this week showed no significant improvement, but also no warning uptick. As seen below, the year-over-year metrics are still running above the 2% Fed target.
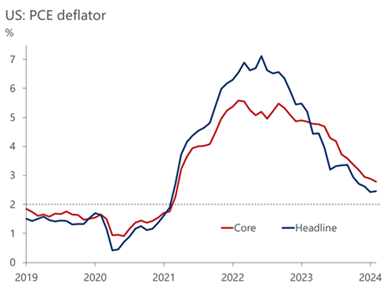
Source: Oxford Economics/Haver Analytics
A secondary measure of confidence put out by Gallup also shows we are not fully believing the strength of the economy. As you see below, we are still not back up to the post-pandemic highs.
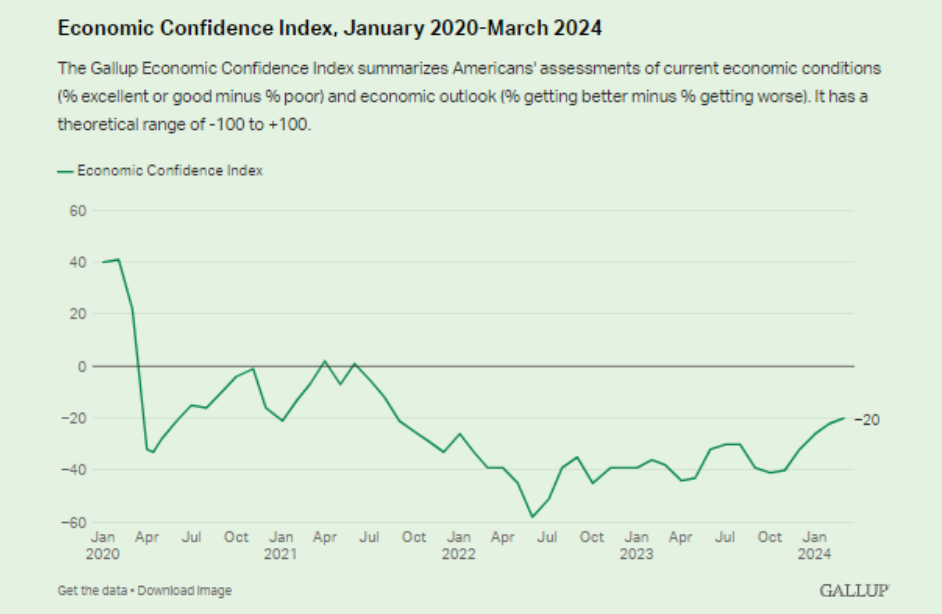
Source: Gallup
Digging deeper
Personal income is hanging in there, and jobless claims continue to be low. As a job is one of the most important factors in people feeling comfortable with spending, why are people not confident?
There are many moving parts here, but let’s take a look at a few. First, how is inflation impacting low-income households? As you see below, they spend more than 59% on essentials such as food and housing.
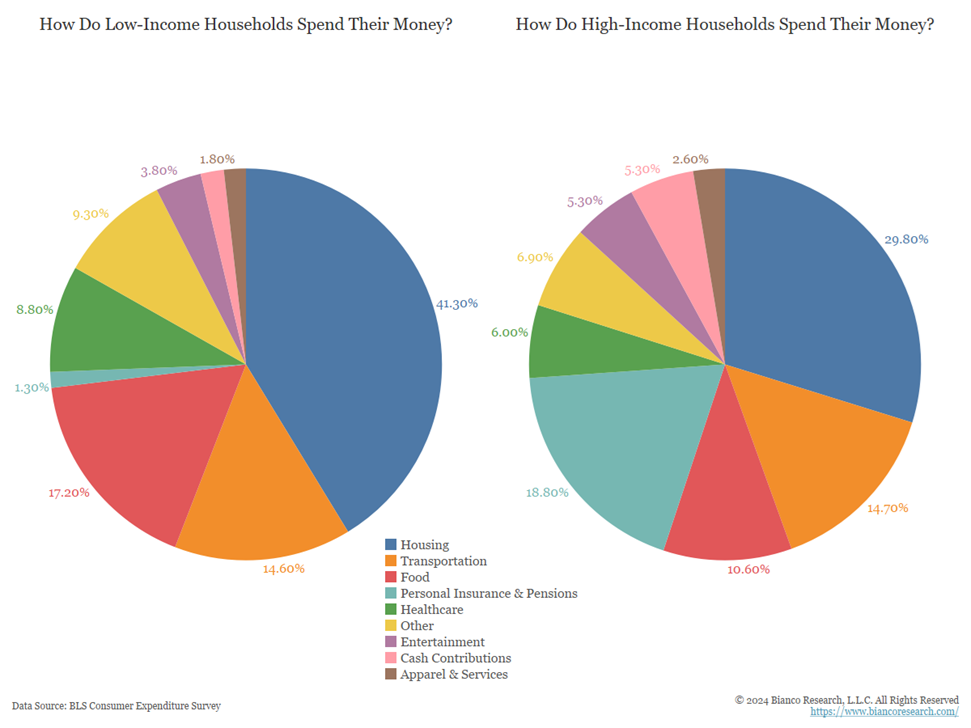
Source: BLS Consumer Expentiture Survey
However, high-income households only spend 40% on these two categories. This allows them more disposable income for non-essentials.
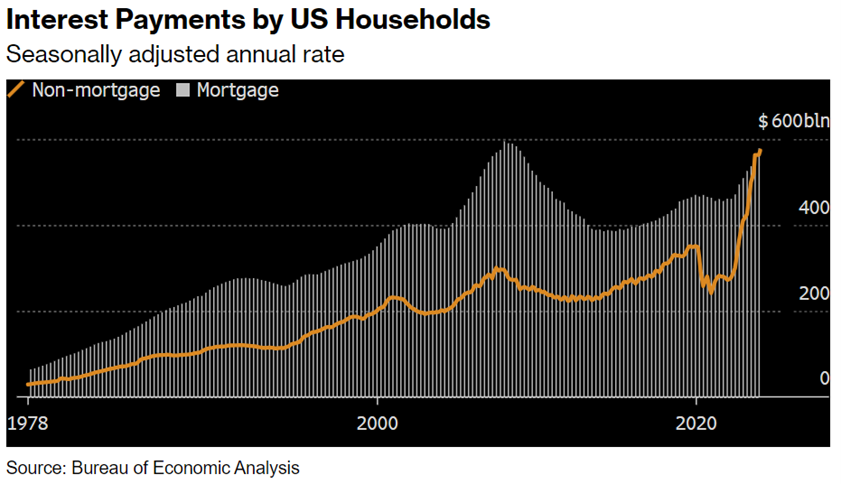
Second, in order for many households to continue to spend, they are relying on debt. The chart below shows the increasing burden of interest payments.
Third, while we have been experiencing lower prices at the pump, this bottomed out earlier this year, and as you see below, has been on the rise. Most everyone has a car to fill up, and this can weigh on your confidence if you see consistently higher numbers costs here.
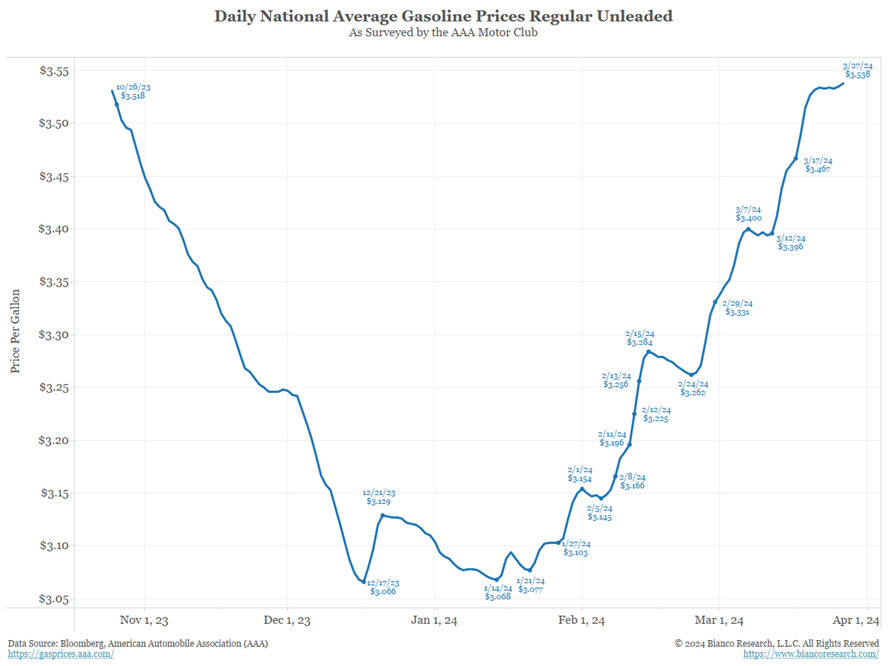
Source: Bloomberg American Automobile Association (AAA)
Finally, the increasingly polarized political environment can add to the uncertainty that families face. Any uncertainty is bad, and with this increasing on multiple fronts, the consumer may start to pull back on spending.
Economic releases
Last week we had consumer confidence releases and the PCE inflation indicator. No major surprises. Fed “talking heads,” following the March FOMC meeting, seem to be saying higher for longer.
This week’s calendar, we have employment information galore. The highlight will be the non-farm release on Friday, but watch the quits data from the JOLTS release for clues to the future. See below for details.
Wrap-Up
Despite a strong labor market, consumer confidence remains in an extended holding pattern. How you respond to a survey may depend on your circumstances, but you need to have a stronger underlying compass guiding you daily.
| Upcoming Economic Releases: | Period | Expected | Previous | |
|---|---|---|---|---|
| 1-Apr | Construction Spending MoM | Feb | 0.7% | -0.2% |
| 1-Apr | ISM Manufacturing Index | Mar | 48.4 | 47.8 |
| 1-Apr | ISM Manufacturing Prices Paid | Mar | 52.8 | 52.5 |
| 1-Apr | ISM Manufacturing Employment | Mar | N/A | 45.9 |
| 1-Apr | ISM Manufacturing New Orders | Mar | 49.8 | 49.2 |
| 2-Apr | JOLTS Job Openings | Feb | 8,775,000 | 8,863,000 |
| 2-Apr | Factory Orders | Feb | 1.0% | -3.6% |
| 2-Apr | Factory Orders ex Transportation | Feb | N/A | -0.8% |
| 2-Apr | Ward's Total Vehicle Sales | Mar | 15,900,000 | 15,810,000 |
| 3-Apr | ADP Employment Change | Mar | 150,000 | 140,000 |
| 3-Apr | ISM Services Index | Mar | 52.8 | 52.6 |
| 3-Apr | ISM Services Prices Paid | Mar | N/A | 58.6 |
| 3-Apr | ISM Services Employment | Mar | N/A | 48.0 |
| 3-Apr | ISM Services New Orders | Mar | N/A | 56.1 |
| 4-Apr | Challenger Job Cuts YoY | Mar | N/A | 8.8% |
| 4-Apr | Initial Jobless Claims | 30-Mar | 215,000 | 210,000 |
| 4-Apr | Continuing Claims | 23-Mar | 1,810,000 | 1,819,000 |
| 5-Apr | Change in Nonfarm Payrolls | Mar | 200,000 | 275,000 |
| 5-Apr | Change in Private Payrolls | Mar | 165,000 | 223,000 |
| 5-Apr | Unemployment Rate | Mar | 3.8% | 3.9% |
| 5-Apr | Avg Hourly Earnings MoM | Mar | 0.3% | 0.1% |
| 5-Apr | Avg Hourly Earnings YoY | Mar | 4.1% | 4.3% |
| 5-Apr | Avg Weekly Hours - All Employees | Mar | 34.3 | 34.3 |
| 5-Apr | Labor Force Participation Rate | Mar | 62.5% | 62.5% |
| 5-Apr | Underemployment Rate | Mar | N/A | 7.3% |
| 5-Apr | Consumer Credit | FEb | $16.400B | $19.495B |
Mark Frears is a Senior Investment Advisor, Executive Vice President, at Texas Capital Bank Private Wealth Advisors. He holds a Bachelor of Science from The University of Washington, and an MBA from University of Texas – Dallas.
The contents of this article are subject to the terms and conditions available here.
Texas Capital Private Bank™ refers to the wealth management services offered by the bank and non-bank entities comprising the Texas Capital brand, including Texas Capital Bank Private Wealth Advisors (PWA). Nothing herein is intended to constitute an offer to sell or buy, or a solicitation of an offer to sell or buy securities.
Investing is subject to a high degree of investment risk, including the possible loss of the entire amount of an investment. You should carefully read and review all information provided by PWA, including PWA’s Form ADV, Part 2A brochure and all supplements thereto, before making an investment.
Neither PWA, the Bank nor any of their respective employees provides tax or legal advice. Nothing contained on this website (including any attachments) is intended as tax or legal advice for any recipient, nor should it be relied on as such. Taxpayers should seek advice based on the taxpayer’s particular circumstances from an independent tax advisor or legal counsel. The wealth strategy team at PWA can work with your attorney to facilitate the desired structure of your estate plan. The information contained on this website is not a complete summary or statement of all available data necessary for making an investment decision, and does not constitute a recommendation. The information has been obtained from sources considered to be reliable, but we do not guarantee that the foregoing material is accurate or complete. Any opinions are those of the authors and not necessarily those of PWA or the Bank.
©2025 Texas Capital Bank Wealth Management Services, Inc., a wholly owned subsidiary of Texas Capital Bank. All rights reserved.
Texas Capital Bank Private Wealth Advisors and the Texas Capital Bank Private Wealth Advisors logo are trademarks of Texas Capital Bancshares, Inc., and Texas Capital Bank.
www.texascapitalbank.com Member FDIC NASDAQ®: TCBI