Close enough to a Bear for a Bottom — Week of May 16, 2022

Strategy and Positioning written by Steve Orr, Chief Investment Officer; and Essential Economics written by Mark Frears, Investment Advisor
| index | wtd | ytd | 1-year | 3-year | 5-year | index level |
|---|---|---|---|---|---|---|
| S&P 500 Index | -2.36 | -15.13 | -0.78 | 14.28 | 12.96 | 4,023.89 |
| Dow Jones Industrial Average | -2.08 | -10.81 | -3.58 | 10.35 | 11.44 | 32,196.66 |
| Russell 2000 Small Cap | -2.50 | -19.83 | -16.54 | 6.41 | 6.65 | 1,792.67 |
| NASDAQ Composite | -2.77 | -24.34 | -9.42 | 16.16 | 15.13 | 11,805.00 |
| MSCI Europe, Australasia & Far East | -1.39 | -15.41 | -11.10 | 4.73 | 4.02 | 1,942.38 |
| MSCI Emerging Markets | -2.60 | -17.94 | -20.32 | 2.32 | 2.71 | 1,004.52 |
| Barclays U.S. Aggregate Bond Index | 0.89 | -9.71 | -8.45 | 0.15 | 1.16 | 2,126.42 |
| Merrill Lynch Intermediate Municipal | -0.44 | -9.05 | -8.42 | -0.24 | 1.26 | 291.15 |
As of market close May 13, 2022. Returns in percent.
Strategy & Positioning
— Steve Orr
Close Enough
The S&P 500 touched Bear territory during trading last Thursday. Bears ran the big index down to 3,858, marking a 19.9% drop from the last intraday high of 4,818 on January 5th.
Inflation remains biggest brick in the Wall of Worry. Two weeks ago, the Fed was going too far to tame inflation and risking a recession. Now rising prices, an already slowing economy, supply chains and war risks a recession. Did we just repeat ourselves? Interest rates rolled over meaningfully last week, with the two-year Treasury falling 0.15% and the ten-year falling a quarter of a point.
Stocks are off to their worst start in 25 years, second only to the 2020 pandemic. The NASDAQ is well into cyclical Bear territory, down 27% this year. U.S. small cap, emerging markets, and consumer discretionary (think Tesla, Home Depot, and Amazon) have also fallen more than 20%. Energy, at +40%, remains a bright spot, but a tiny one, making up only 4.2% of the S&P 500.
Bonds have round tripped the pandemic, vaulting above their starting yields. The entire yield curve from two to thirty-year maturities have returned to their levels at the end of 2018. That December should stir a memory in investors. The yield curve was close to inversion and stocks had dropped 16% from their October high, thanks to Fed Chairman Powell’s insistence on shrinking the Fed’s balance sheet. Manufacturing PMI surveys had rolled over and fallen from 61 to 55. The unemployment rate was 3.9% and falling. Today PMIs have fallen from 63 to 55 and April unemployment hit 3.6%. A slowing economy and falling stock market convinced the Fed to back off its balance sheet plans in early January 2019. Result: 10-year yields fell 0.8% and the S&P 500 rose nearly 29%.
Correct Me
Recession is the dominant theme in the media. We wonder if the media can talk an economy into recession. “Recession is on the horizon” they say. Well since we live in a cyclical economy, a recession is always on the horizon. The key is whether that recession valley is weeks around the corner or year(s). Current economic readings are slowing as they should, but not indicating recession any time soon.
Economic data such as the Purchasing Manager’s Indices and unemployment numbers above may give a deceptive appearance that all is well. Stock market internals have not been well since late February. We do see a few data points close to bottoms here and there, but they are isolated. A typical Non-Recession Bear or Correction has a list of internal markers that get checked off before a low is made. In no order: S&P 500 volatility as measured by the VIX: above 40. No, only near 35 despite the amazing number of 2% daily vol days. At least 50% of stock markets around the globe making new lows. No – only 11%. How about less than 14% of all stocks below their 200-day moving average? No – but close at 24%. Less than 20% of S&P 500 stocks above their moving averages? Yes! Only 13%.
That low reading of S&P 500 stocks in uptrends is weighed down by the number of tech stocks in the index. Like the NASDAQ, the tech sector has been drug to the middle of the lake with concrete. The Global X Social Media index (Facebook, Twitter, Match, etc.) is down 55% from its peak. Correct us if we are wrong, but we think Alphabet (Google), Apple and Amazon will make it through any recession. Perhaps there are some values lurking in there.
Sentiment, how investors view markets and whether they are hedging, is at its lowest since the pandemic driven bottom in March 2020. Investor polls are close to bottom levels, and institutional sentiment has reached extreme pessimism levels. Both suggest a bottom is coming and higher returns are possible over the next year.
What If
Markets never travel in a straight line. If we are in a Bear, Secular Bulls can last anywhere from 12 to 17 years and Bears rarely last more than three years. Most Secular Bulls have several Cyclical Bulls punctuated by shorter Bear Cycles. Non-Recessionary Bear cycles tend to last about half as their Recession cousins. Ned Davis Research counts eight Non-Recession Bears since 1970. They average 207 days in length and a drop of 18%. Comparing this 18% drop with the last four mid-term election year drops of 19% we are in the ballpark for a cycle bottom. What if we are near a bottom for this correction? Our checklist above is not a requirement, just some of the internals we have seen at prior bottoms.
A bottoming process would have to start with some good news from somewhere. One sign is easing case counts in some Chinese cities. In late April over 370 million people in 45 major cities were in some level of lockdown. Even if their port cities reopen tomorrow, it will take months to get regular trade back on schedule. Supply chains traveling through China affect prices and inventories in many markets. Here at home a driver of our inflation was fiscal policy, an economic term for spending by Congress. Despite record corporate tax revenue flowing into D.C., Congress is not in a spending mood. Be on the look out for one spending item – Congress should reauthorize a subsidy program for Obama Care insurance premiums. That may be the only part of “Build Back Better” that makes it into law this year.
Wrap-Up
The current financial and economic conditions do not show a recession this year. We think 2023 could see as much as a one-third chance of recession. The drivers remain inflation, supply chains and war. After six weeks of impressive daily volatility our indicators are slowly moving towards bottoming. We are encouraged but patient.
Essential Economics
— Mark Frears
How can that be?
Several years ago, my wife and I had the opportunity to walk in the New Year’s Day Cotton Bowl parade, holding onto a rope. When we arrived, very early, there was a big pile of stuff on the ground where we met. Very soon, they brought out a machine that was attached to the pile and soon it began to take shape. As helium was directed into the bladder, the shape of Little Orphan Annie began to come to life. Then they told all the group that we would be holding this balloon in formation. Let me tell you, it was not an easy task to keep it under control, very much like the FOMC trying to keep inflation in check.
Food and Energy
This past week, the markets were very focused on the Consumer Price Index (CPI) release, looking for some sign of slowing inflation. The monthly changes were higher than what the market was expecting, but the year-over-year numbers for both overall and for core (excluding food and energy) were lower than March. So, depending on which news source you looked at, it was spun as “higher” or “lower.”
While we are all experiencing higher prices in our daily lives, whether at the gas pump or the grocery store, the positive note is that while inflation is still growing, it is slowing down.
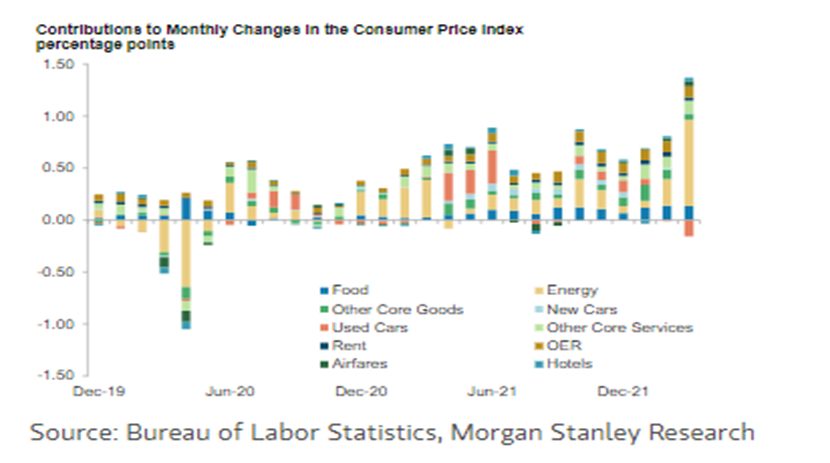
One trend we are watching has to do with goods versus services. As you can see in the chart below, the initial source of higher prices was in the goods sectors due to a narrow set of supply chain issues. We then saw inflation creeping out into services, primarily driven by higher labor costs. Higher food and energy prices are now hitting the headline numbers, but remember the Fed pays more attention to the core metrics as they see food and energy price increases as more volatile.
As the Fed continues to raise short-term rates and demonstrates to the markets that they are serious about fighting inflation, we will see the economy start to slow and inflation moving back toward more normal levels later this year.
Inputs
We also glimpsed under the hood at the producer inflation level. The Producer Price Index (PPI) April monthly change came in as expected, about a third of the March increase. Food and energy prices rose 1.5% and 1.7%, respectively, the smallest gains of the year.
Goods for producers rose 1.3% on the month, with Services unchanged, at the lowest level since the end of 2020.
The headline number of 11% year-over-year was a headline grabber and excluding food & energy was up 8.8%. As with CPI, these were both lower than the previous month. Are we seeing the peak?
How are you feeling?
Is inflation changing your spending habits? The University of Michigan (Go State) Consumer Sentiment release showed declining sentiment in early May. The underlying metrics to this release lean toward prices. The Conference Board Consumer Confidence number is more influenced by job market, and that is why it has not fallen as far. The consumer still has a strong balance sheet, increased savings, and the willingness to use credit cards, therefore spending continues.
Wrap-Up
While we were walking the parade route, the wind did not pick up and we were very thankful for that, as it would have made controlling Annie very difficult. The winds of inflation are still blowing, but perhaps a shift is in the works.
| Upcoming Economic Releases: | Period | Expected | Previous | |
|---|---|---|---|---|
| 16-May | Empire Manufacturing | May | 15.0 | 24.6 |
| 17-May | Retail Sales MoM | Apr | 0.9% | 0.5% |
| 17-May | Retail Sales ex Autos MoM | Apr | 0.3% | 1.1% |
| 17-May | Industrial Production MoM | Apr | 0.4% | 0.9% |
| 17-May | Capacity Utilization | Apr | 78.5% | 78.3% |
| 17-May | Business Inventories | Mar | 1.9% | 1.5% |
| 17-May | NAHB Housing Market Index | May | 75 | 77 |
| 18-May | Building Permits | Apr | 1,820,000 | 1,873,000 |
| 18-May | Building Permits MoM | Apr | -2.7% | 0.4% |
| 18-May | Housing Starts | Apr | 1,765,000 | 1,793,000 |
| 18-May | Housing Starts MoM | Apr | -1.6% | 0.3% |
| 19-May | Initial Jobless Claims | 14-May | 200,000 | 203,000 |
| 19-May | Continuing Claims | 7-May | 1,320,000 | 1,343,000 |
| 19-May | Existing Home Sales | Apr | 5,650,000 | 5,770,000 |
| 19-May | Existing Home Sales MoM | Apr | -2.1% | -2.7% |
| 19-May | Leading Index | Apr | 0.0% | 0.3% |
Mark Frears is an Investment Advisor at Texas Capital Bank Private Wealth Advisors. He holds a Bachelor of Science from The University of Washington, and an MBA from University of Texas – Dallas.
Steve Orr is the Executive Vice President and Chief Investment Officer for Texas Capital Bank Private Wealth Advisors. Steve has earned the right to use the Chartered Financial Analyst and Chartered Market Technician designations. He holds a Bachelor of Arts in Economics from The University of Texas at Austin, a Master of Business Administration in Finance from Texas State University, and a Juris Doctor in Securities from St. Mary’s University School of Law. Follow him on Twitter here.
The contents of this article are subject to the terms and conditions available here.