Another big month for job gains this Friday — Week of March 28, 2022

Strategy and Positioning written by Steve Orr, Chief Investment Officer; and Essential Economics written by Mark Frears, Investment Advisor
| index | wtd | ytd | 1-year | 3-year | 5-year | index level |
|---|---|---|---|---|---|---|
| S&P 500 Index | 1.81 | -4.35 | 17.83 | 19.24 | 16.21 | 4,543.06 |
| Dow Jones Industrial Average | 0.31 | -3.60 | 8.88 | 13.17 | 13.57 | 34,861.24 |
| Russell 2000 Small Cap | -0.38 | -7.22 | -3.85 | 12.15 | 10.30 | 2,077.98 |
| NASDAQ Composite | 1.99 | -9.27 | 9.94 | 23.69 | 20.60 | 14,169.30 |
| MSCI Europe, Australasia & Far East | 0.20 | -6.96 | 1.34 | 7.94 | 7.04 | 2,159.53 |
| MSCI Emerging Markets | 0.22 | -8.39 | -10.53 | 5.02 | 5.77 | 1,125.01 |
| Barclays U.S. Aggregate Bond Index | -1.82 | -6.89 | -5.36 | 1.36 | 1.95 | 2,192.96 |
| Merrill Lynch Intermediate Municipal | -1.27 | -5.92 | -4.58 | 1.31 | 2.23 | 301.17 |
As of market close March 25, 2022. Returns in percent.
Strategy & Positioning
— Steve Orr
- Rally pulls into the center of a new trading range
- Stocks likely neutral for now
- Wall Street trying to get ahead of the Fed’s rate increase plans
- March jobs report this Friday will show continued economic growth
Assault
Two weeks of stock rallies have calmed traders a bit. The S&P 500’s 8% gain since the 14th low has been impressive, with only two down days. Is this the turn? A strong enough thrust to regain the highs perhaps. Not so fast. We do appreciate the strength of the rip. The S&P 500, Dow Utilities and Transports have assaulted and broken through all their moving average resistance levels. Mid- and small-cap stocks along with the Dow Industrials managed to slog through their 21- and 50-day moving averages but have stalled near their 200-day (trailing year) averages.
We agree with Mark Twain, who remarked once that history rhymes. Last Tuesday the S&P 500 broke above its 200-day moving average for the first time since falling below it in late February. On cue, Wednesday the 23rd was a down day — just like 60% of the prior March 23rds over the last 20 years. A fitting two-year anniversary for the pandemic low and the one-year anniversary of the Ever Given getting stuck in the Suez Canal.
Internals, breadth and relative strength have all improved but are in neutral territory. VIX, the measure of expected daily price movements by the S&P 500 in the next 30 days, has fallen by a third. At 21, it is still elevated but out of fear territory. Traders are still expecting plenty of 1% or more moves in the coming weeks. The intermediate trend is still down however, and very short-term is neutral to higher.
The major indices have retraced at least half of their drop for the year. The S&P 500 is down a mild 4.7%, vs its early March low of -12.9%. Earnings season does not start until April 13th.
Next
The two-year anniversary of the pandemic low last Wednesday is a good point to take stock (pun). Since the low on March 23, 2020, according to Strategas Research, over $1 trillion has flowed into U.S. stock ETFs. A remarkable $430 billion has flowed into bond ETFs, despite ultra-low interest rates.
Until earnings season starts, most of the S&P 500 will be in blackout, meaning they cannot buy back their shares. This removes one pillar of strength from under the market. The S&P 500 is up roughly 3% since September. Fed in tightening mode, surging inflation and the Russian invasion have dampened returns and investor sentiment. This is also the third year of a Bull cycle and a mid-term election year.
April has the best track record for the S&P 500 and Dow Industrials. Over the last 70 years, the S&P has risen 52 times for an average gain of just over 1.5%. Mid-term years are not so kind, averaging just a 0.2% gain, according to the Stock Trader’s Almanac. Third years of a Bull generally have lower returns than the previous two. Mid-term years are always bumpy through the summer. For stocks, any one of the above “Four Horsemen” should be enough for a correction. That most stocks are only down between 3% and 15% after having all four stirring up volatility keeps us “positively” neutral.
Another Powell Punch
Bonds are not in the happy neutral camp. Most bond indices are finishing the first quarter with one of their worst quarters since their creation. 30-year Treasury bonds have fallen in price between 12% and 15%, depending on the maturity. 10-year Treasuries are lower by at least 8%. The U.S. Barclays Aggregate is off 7% year-to-date.
Over a third of the drop in bond prices occurred since Fed Chairman Powell’s speeches after the Fed meeting. In two speeches he raised the possibility of one or more half-percent rate increases. To a market accustomed to measured (read: slow) quarter-point increases, this was a jolt. Futures and cash bonds quickly repriced, and Wall Street analysts competed to see who could raise their forecasts to be the “worst.”
Citigroup took the prize on Friday, forecasting that the Fed may raise rates a half point at the next four meetings. That would place overnight rates at 2.25% before Halloween and possibly 3% by the end of the year. A week ago, markets were estimating year-end rates at 2%.
The 2-year Treasury note is a good proxy for where short-term rates are headed. As Mark details below, a 2-year Treasury yield today of 2.33% is not far from the Fed’s 2.8% target in two years. The graph below merits a couple of comments. First note the 40-plus year downtrend in interest rates. We will take that up at another time. The key is the long-term trend has been down. Second, note the reaction from the end of the pandemic through today. The 2-year note bottomed at 9 basis points and now trades at 2.33%. From here to 2.8% is not a large change in price. The point: much of the damage in bond prices has been done. In the coming months, higher interest income from increased yields will heal much of the damage in intermediate-term portfolios.
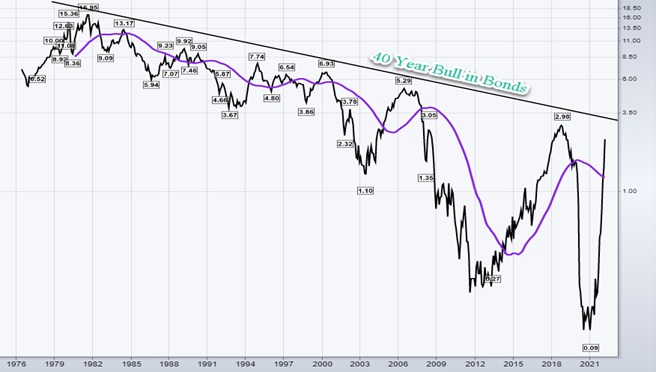
Source: http://www.stockcharts.com/
It is important to note that markets generally overshoot in a regime or trend change. The ending of the Fed’s bond buying program will tighten liquidity conditions over the next year equivalent to at least a quarter-point rate increase. Inflation, especially at the gas pump, is already lowering activity. Pencil in at least another quarter-point increase. In effect, the Fed has raised rates nearly three-quarters of a point.
If the Fed moves too quickly, a la Citigroup above, markets may find themselves staring at European war recession, food and diesel shortages and a Fed oblivious to anything but the next Personal Consumption Expenditures reading (the Fed’s favorite inflation gauge). That would be a risk recipe that would move our intermediate indicators below neutral. Here’s to the Fed watching global events and “being nimble” regarding the number and scale of rate increases. We think there are more opportunities for the Fed to move too far and too fast in the face of slowing growth in China and Europe.
Essential Economics
— Mark Frears
What are you watching?
When I take my early morning walks around the neighborhood, I have started to pay close attention to whether the rabbits are hopping around with me. They are my indicator as to the presence of coyotes! If there are no bunnies, the coyotes are often out. I have started to see the varmints more frequently, so this is an important forewarning to me. What are the markets watching?
Leading Economic Index (LEI)
This indicator does not get a lot of press, but its actual job is to look into the future. It has ten components, including employment, new goods orders, housing, stock markets, credit, interest rates and consumers expectations.
The LEI increased 0.3% in February, following a 0.5% decrease in January and a 0.8% increase in December. Current level of 119.9 is still off the all-time high of 131.9 in December 2021.
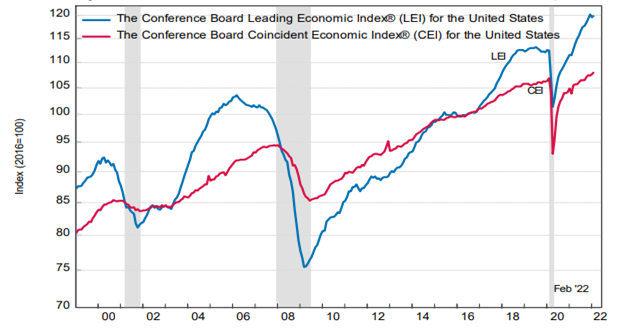
Source: https://www.conference-board.org/pdf_free/press/US LEI PRESS RELEASE - March 2022.pdf
While the Russian-Ukraine conflict is not fully baked in here, the trend is still very positive.
Yield Curve
The “yield curve” is getting a lot of press lately. What exactly are they looking at? The risk of recession is the message being delivered, based on a potentially inverting yield curve. This means that the yields on shorter investments are higher than yields on longer ones. Longer term investments have less yield than shorter ones, as the perception is that the economy will be not performing as well in the future.
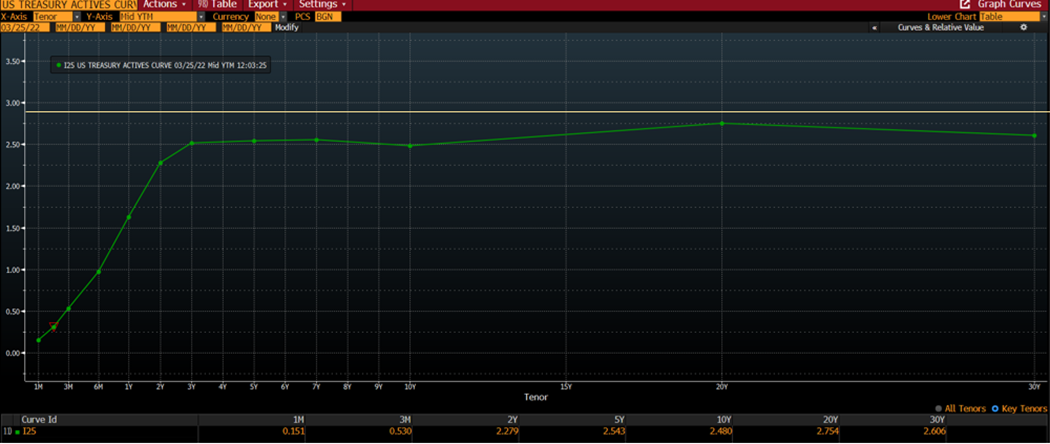
Source: http://www.bloomberg.com/
The usual section of the curve that people watch for this indication is the area between two-year and 10-year maturities. Looking at the U.S. Treasury (UST) curve above, you can see the curve between these two points is very flat. On Friday, the two-year yielded 2.29% and 10-year 2.47%; this spread is 0.18%, or 18 basis points. Six months ago, this spread was 1.17%, significantly wider.
The primary reason this has occurred is that the FOMC has stated they will aggressively fight inflation by raising the overnight Fed Funds rate by as much as 1.50% this year. The UST market hears this and starts to build it into their expectations. Does this mean we are headed towards recession? At some point, yes, the business cycle will get there, but we need to look at other parts of the curve as well. If you look at more of the curve, from three months out to 10 years, this difference is 1.95%. That is steeper than it was six months ago. The New York Fed has built a probability model around this curve, using it to predict recessions. As of February of this year, the chance of recession in the next 12 months was only 6%.
The other thing to notice on this graph is the solid line across at 2.80%. That is the expected terminal rate for Fed Funds, or where futures predict the FOMC will stop raising overnight rates. So, if the FOMC is serious about this terminal rate, the UST market rates will have to go higher, if we are to have a positive yield curve. Right now, the market believes the Fed will not raise rates to this level, at least in the near term.
Real rates are nominal rates (UST curve) minus inflation. As inflation is still very high, real rates are negative. The FOMC is raising rates to fight inflation, that is, remove the accommodative/stimulative low interest rates. They have a long way to go to take the punch bowl from the economy. As we have rarely been in this low a nominal rate environment, it is new territory for the FOMC to navigate, trying to fight inflation without choking off the economic engine.
Consumer
As you and I are two-thirds of what drives economic growth, we need to pay attention to the behavior and views of the consumer. The University of Michigan Consumer Sentiment is weighted towards prices and, by connection, inflation. The reading for March is 59.4, down from 62.8 last month and 84.9 a year ago. Inflation is weighing on people’s mind. Expectations for inflation one year from now are at 5.4%, the same as last month. That would tell you they have reached a peak, for now. Inflation expectations for five to 10 years in the future is at 3.0%, the same as last month. This would tell you that inflation is expected to fall back to more normal levels.
Wrap-Up
When you are looking around, either at home or in your view of the economy, make sure you dig into the details to get the most accurate picture of the future. I am carrying a stick now on my early morning walks; not sure if it will deter the coyotes, but it helps my view of the future.
With the war grinding to a stalemate, inflation dominating the rate outlook and possible food shortages far on the horizon, markets have plenty of worries. Markets climb a wall of worry in due time. We will address some of the risks to our outlook over the next several weeks. The largest risk remains the Fed moving too fast. In the meantime, interest rates are headed higher, and we wonder when they will overshoot and retrace some of their rise — likely in the summer.
| Upcoming Economic Releases: | Period | Expected | Previous | |
|---|---|---|---|---|
| 28-Mar | Wholesale Inventories MoM | Feb pre | 1.2% | 0.8% |
| 28-Mar | Retail Inventories MoM | Feb | 1.3% | 1.9% |
| 28-Mar | Dallas Fed Manufacturing Activity | Mar | 10 | 14 |
| 29-Mar | FHFA House Price Index MoM | Jan | 1.3% | 1.2% |
| 29-Mar | S&P House Price Index MoM | Jan | 1.50% | 1.46% |
| 29-Mar | Conf Board Consumer Confidence | Mar | 107.0 | 110.5 |
| 29-Mar | Conf Board Present Situation | Mar | N/A | 145.1 |
| 29-Mar | Conf Board Expectations | Mar | N/A | 87.5 |
| 29-Mar | JOLTS Job Openings | Feb | 11,000,000 | 11,263,000 |
| 30-Mar | ADP Employment Change | Mar | 450,000 | 475,000 |
| 30-Mar | GDP Annualized QoQ | Q4 | 7.1% | 7.0% |
| 30-Mar | Personal Consumption | Q4 | 3.1% | 3.1% |
| 31-Mar | Personal Income | Feb | 0.5% | 0.0% |
| 31-Mar | Personal Spending | Feb | 0.5% | 2.1% |
| 31-Mar | Real Personal Spending | Feb | -0.2% | 1.5% |
| 31-Mar | PCE Deflator YoY | Feb | 6.4% | 6.1% |
| 31-Mar | PCE Core Deflator YoY | Feb | 5.5% | 5.2% |
| 31-Mar | Initial Jobless Claims | 26-Mar | 200,000 | 187,000 |
| 31-Mar | Continuing Claims | 19-Mar | 1,350,000 | 1,350,000 |
| 1-Apr | Change in Nonfarm Payrolls | Mar | 480,000 | 678,000 |
| 1-Apr | Change in Private Payrolls | Mar | 495,000 | 654,000 |
| 1-Apr | Unemployment Rate | Mar | 3.7% | 3.8% |
| 1-Apr | Average Hourly Earnings MoM | Mar | 0.4% | 0.0% |
| 1-Apr | Labor Force Participation Rate | Mar | 62.4% | 62.3% |
| 1-Apr | Underemployment Rate | Mar | N/A | 7.2% |
| 1-Apr | S&P Global US Manufacturing PMI | Mar | 58.5 | 58.5 |
| 1-Apr | Construction Spending MoM | Feb | 1.0% | 1.3% |
| 1-Apr | ISM Manufacturing | Mar | 58.8 | 58.6 |
| 1-Apr | ISM Prices Paid | Mar | 80.5 | 75.6 |
| 1-Apr | ISM New Orders | Mar | N/A | 61.7 |
| 1-Apr | ISM Employment | Mar | N/A | 52.9 |
| 1-Apr | Wards Total Vehicle Sales | Mar | 13,900,000 | 14,070,000 |
Mark Frears is an Investment Advisor at Texas Capital Bank Private Wealth Advisors. He holds a Bachelor of Science from The University of Washington, and an MBA from University of Texas – Dallas.
Steve Orr is the Executive Vice President and Chief Investment Officer for Texas Capital Bank Private Wealth Advisors. Steve has earned the right to use the Chartered Financial Analyst and Chartered Market Technician designations. He holds a Bachelor of Arts in Economics from The University of Texas at Austin, a Master of Business Administration in Finance from Texas State University, and a Juris Doctor in Securities from St. Mary’s University School of Law. Follow him on Twitter here.
The contents of this article are subject to the terms and conditions available here.