Winter is coming — Week of December 4, 2023

Essential Economics
— Mark Frears
Seasons
As we have reached the last month of the year, it is time to adjust to winter. In Texas this is not as severe a contrast as up north, but it still takes getting used to. With all the leaves finally starting to fall, we go into a dormant growth stage. While we don’t usually have extended periods of freezing temperatures, the grass and many plants go into hibernation.
One of the biggest debates in the current economic picture is whether we are going into a “winter” phase, or is it more springlike?
GDP
The broadest measure of economic health is Gross Domestic Product (GDP), two-thirds of which is driven by consumer spending. While we only see this metric after the quarter is over, the third quarter was overwhelmingly strong as you can see below.
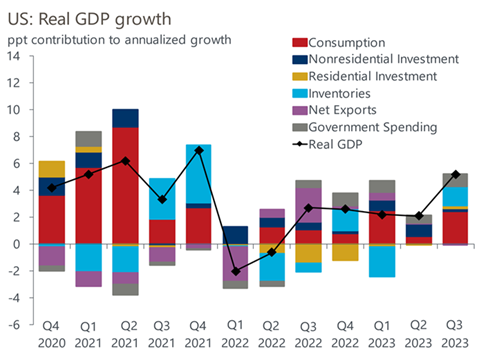
Source: Oxford Economics/Haver Analytics
As seen in the red Consumption section, the consumer continues to spend. Again, this is history, yet does the consumer change spending habits on a dime? Most likely not.
What does the crystal ball say about the future? As you can see below in the Atlanta GDPNow estimate for Q4, they expect a much slower pace, in line with the Blue Chip forecast at just over 1%, a significant slowing from Q3.
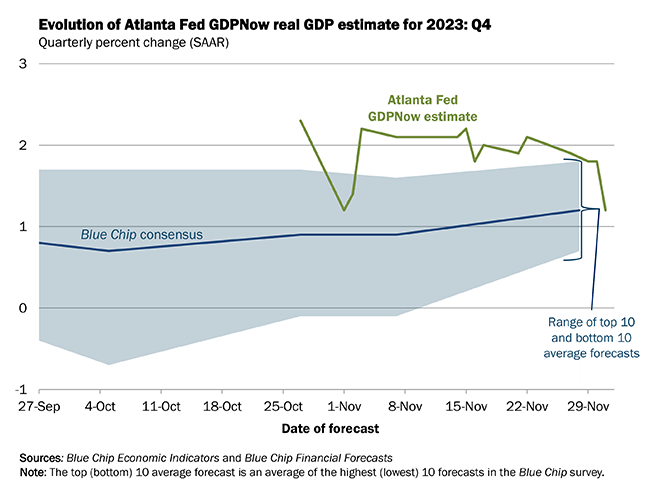
Source: Atlanta Federal Reserve
Contributing to the slowdown in Q4 is expectation that the consumer is tapped out and will have to slow spending. Incomes are no longer rising, and inflation continues to take a significant bite out of purchasing power. Another sign of slowing consumer activity is the Foot Traffic Index shown below.
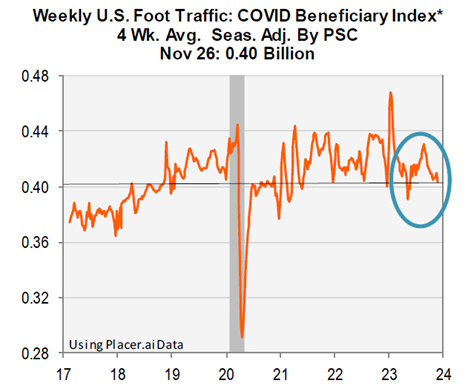
Source: PSC Research
*This index captures traffic at grocery stores, sporting goods stores, home improvement stores, home furnishing stores, discount stores, electronics stores and superstores.
On the business side, as you can see below, equipment and CapEx spending continues to fall.
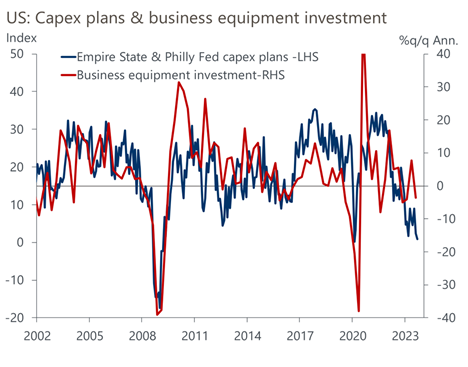
Source: Oxford Economics/Haver Analytics
While this does not portend the most anticipated recession ever, we will see enough of a slowing to cause a change in behavior, something we have been waiting for since the Fed started to tighten.
Labor
Does the job market have a springlike buoyancy or one more reflective of a long, dark winter? We will get an update on this picture this week with JOLTS, ADP and nonfarm payroll releases. The nonfarm payroll for last month showed an addition of 150,000 jobs, and as you can see below, we are still adding jobs each month.
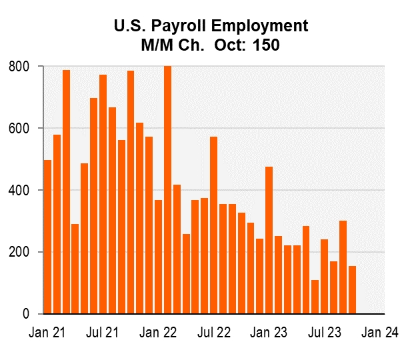
Source: PSC Research
We are expecting to see 180,000 jobs added in November — not a recessionary picture here. This is one of the primary areas that the Fed is watching. Until the supply and demand for labor gets closer to an equilibrium point, employers will have to pay up to attract and keep workers.
There are a few areas of “winter” starting to show in the labor market. Continuing Unemployment claims show people who are still out of work and needing assistance. As you can see below, this number is on the rise.
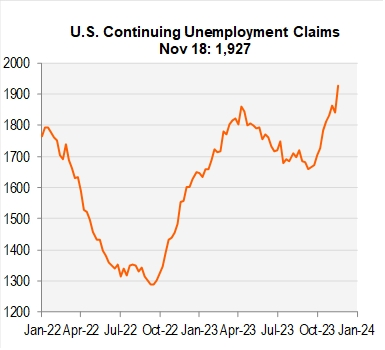
Source: PSC Research
Another area that shows a cooling labor market comes from the Job Openings and Labor Turnover Survey (JOLTS). The number of people quitting jobs has started to slow, as they no longer see it as easy to quickly find another job. This is a good leading indicator for slowing wages, as you can see below.
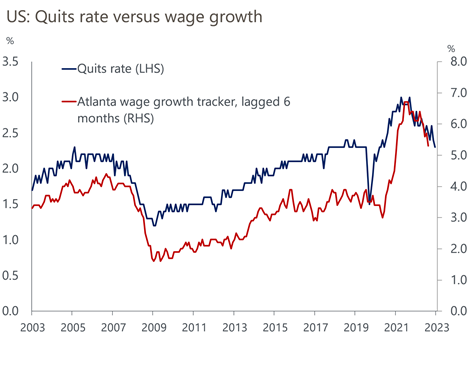
Source: Oxford Economics/Haver Analytics
The labor market indicators coming out this week (see table at the bottom) will give us an excellent insight into the coming temperature of the economy.
Inflation
Now we come to an issue that impacts everyone and has direct correlation to coming weather. The Fed has two primary goals: full employment and price stability. Right now, they are focused on the latter by tightening money supply, causing the economy to slow, and therefore lowering demand. They have a published goal for inflation that comes out quarterly in their Summary of Economic Projections (SEP). It is captured in the Personal Consumption Expenditures (PCE) core year-over-year metric, and as of September, this was 3.7% for year-end 2023.
This release for October came in at 3.5%, so they are on track to achieve their goal, as seen in the yellow line below. This chart also shows the often-stated long-term goal of 2%.
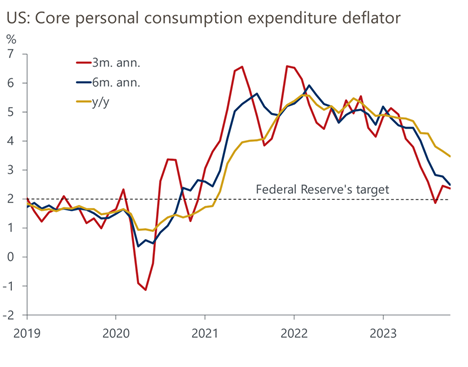
Source: Oxford Economics/Haver Analytics
The chart above also shows three and six months annualized for a picture of month-over-month momentum. This would indicate good progress, but a possible slowing of improvement could cause the FOMC to keep their target rate higher for longer.
On the other hand, while the Fed is seeing improvement, how is inflation impacting you and me? We have to pay more now, and on average it costs over $119 to buy what cost $100 before the pandemic. This is as big an increase as there was in the 10 years before the pandemic. The chart below gives you an idea of where these increases show up.
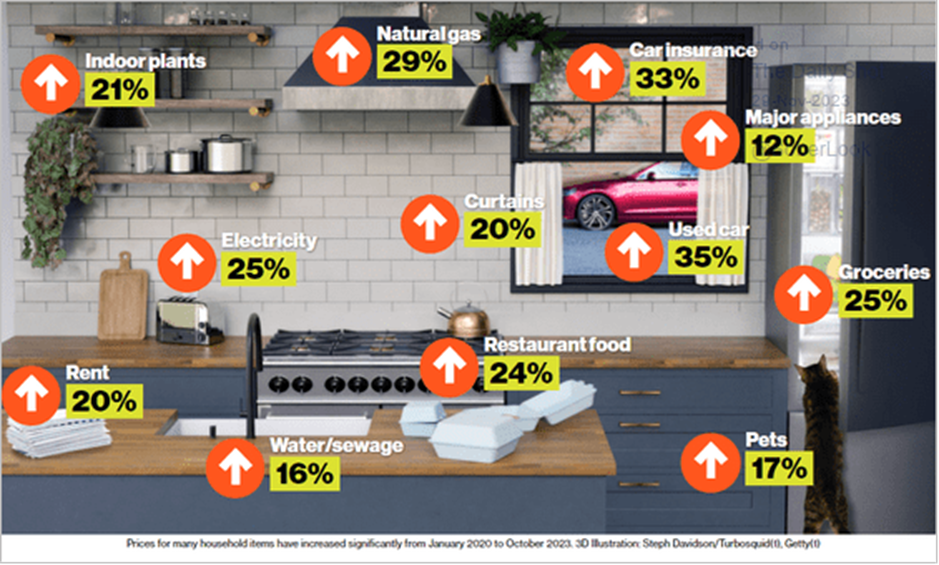
Source: Bloomberg.com
As your housing component is the largest part of your budget, a 20% increase over an extended period will cause significant strain on a family’s finances. Despite progress, still a cold outlook for the consumer.
Economic releases
Last week saw a mixed bag, with GDP stronger than expected, as well as Consumer Confidence Expectations. On the other side, continuing claims continue to rise, spending was lower for October, and the ISM numbers still show contraction.
This week’s calendar is all about jobs. JOLTS, ADP and Payrolls are the highlights. In addition, we have ISM Services and Productivity. See below for details.
Wrap-Up
Despite what the Farmer’s Almanac is forecasting, it does not look like a severe winter in the economy. We will have cooler temperatures, but that should be expected given the sticky inflation picture. Hope you are enjoying the fall weather, as we enter the last month of the year.
description text
| Upcoming Economic Releases: | Period | Expected | Previous | |
|---|---|---|---|---|
| 4-Dec | Factory Orders | Oct | -3.0% | 2.8% |
| 4-Dec | Factory Orders ex Transportation | Oct | N/A | 0.8% |
| 5-Dec | JOLTS Job Openings | Oct | 9,300,000 | 9,553,000 |
| 5-Dec | ISM Services Index | Nov | 52.3 | 51.8 |
| 5-Dec | ISM Services Prices Paid | Nov | N/A | 58.6 |
| 5-Dec | ISM Services Employment | Nov | N/A | 50.2 |
| 5-Dec | ISM Services New Orders | Nov | N/A | 55.5 |
| 6-Dec | ADP Employment Change | Nov | 120,000 | 113,000 |
| 6-Dec | Nonfarm Productivity | Q3 | 4.9% | 4.7% |
| 6-Dec | Unit Labor Costs | Q3 | -0.9% | -0.8% |
| 6-Dec | Trade Balance | Oct | -$64.2B | -$61.5B |
| 7-Dec | Challenger Job Cuts YoY | Nov | N/A | 8.8% |
| 7-Dec | Initial Jobless Claims | 2-Dec | 222,000 | 218,000 |
| 7-Dec | Continuing Claims | 25-Nov | 1,910,000 | 1,927,000 |
| 7-Dec | Household Change in Net Worth | Q3 | N/A | $5,494B |
| 7-Dec | Consumer Credit | Oct | $8.500B | $9.057B |
| 8-Dec | Change in Nonfarm Payrolls | Nov | 180,000 | 150,000 |
| 8-Dec | Change in Private Payrolls | Nov | 160,000 | 99,000 |
| 8-Dec | Unemployment Rate | Nov | 3.9% | 3.9% |
| 8-Dec | Avg Hourly Earnings MoM | Nov | 0.3% | 0.2% |
| 8-Dec | Avg Hourly Earnings YoY | Nov | 4.0% | 4.1% |
| 8-Dec | Labor Force Participation Rate | Nov | 62.7% | 62.7% |
| 8-Dec | Underemployment Rate | Nov | N/A | 7.2% |
| 8-Dec | UM (Go UW) Consumer Sentiment | Nov | 62.0 | 61.3 |
| 8-Dec | UM (Go UW) Current Conditions | Nov | 67.2 | 68.3 |
| 8-Dec | UM (Go UW) Expectations | Nov | 56.5 | 56.8 |
| 8-Dec | UM (Go UW) 1-yr inflation | Nov | 4.3% | 4.5% |
| 8-Dec | UM (Go UW) 5- to 10-yr inflation | Nov | 3.0% | 3.2% |
Mark Frears is a Senior Investment Advisor, Managing Director, at Texas Capital Bank Private Wealth Advisors. He holds a Bachelor of Science from The University of Washington, and an MBA from University of Texas – Dallas.
The contents of this article are subject to the terms and conditions available here.