Job gains in May keep the Fed in play – Week of June 6, 2022

Strategy and Positioning written by Steve Orr, Chief Investment Officer; and Essential Economics written by Mark Frears, Investment Advisor
| index | wtd | ytd | 1-year | 3-year | 5-year | index level |
|---|---|---|---|---|---|---|
| S&P 500 Index | -1.15 | -13.23 | -0.61 | 15.50 | 12.97 | 4,108.54 |
| Dow Jones Industrial Average | -0.83 | -8.62 | -3.01 | 11.46 | 11.60 | 32,899.70 |
| Russell 2000 Small Cap | -0.23 | -15.72 | -16.48 | 8.99 | 7.35 | 1,883.05 |
| NASDAQ Composite | -0.95 | -22.94 | -11.12 | 17.90 | 14.85 | 12,012.73 |
| MSCI Europe, Australasia & Far East | -0.10 | -11.19 | -10.42 | 6.60 | 4.42 | 2,032.45 |
| MSCI Emerging Markets | 1.85 | -13.01 | -21.21 | 4.54 | 3.63 | 1,061.44 |
| Barclays U.S. Aggregate Bond Index | -0.73 | -9.13 | -8.21 | -0.11 | 1.09 | 2,140.03 |
| Merrill Lynch Intermediate Municipal | 0.30 | -6.53 | -6.19 | 0.43 | 1.56 | 299.21 |
As of market close June 3, 2022. Returns in percent.
Strategy & Positioning
— Steve Orr
Crossroads
A lackluster start for the month of June unfortunately fits history. The end of May rally was more about squaring up pension fund allocations and Fed probabilities than a true change in market tone. Continued labor market strength last month plus a speech by Fed Governor Waller dimmed rally hopes.
There was some optimism at the end of May that markets had bottomed, and stocks had reached a crossroads of sorts – continue higher in a rare summer rebound or sideways waiting for the mid-term elections. Our dashboard of chart indicators suggests stocks are taking the off-ramp and driving around in circles for several weeks. Bottoming processes for markets usually involve reaching extremes in certain areas. Economic growth, valuations, M&A, and sentiment are a start.
The economy is slowing but remains in fine shape. Odds of a recession in the fall of 2023 sit at 35% in our view. Global economic conditions are closer to recession levels. Some amount of last year’s wheat crop is leaving Ukraine, mostly by truck and train through Poland. This year’s harvest is another matter. China lockdowns have dropped from 25% of the population to “only” 8%, according to sources there. It will be months before ports return to normal. In the meantime contract talks covering dockworkers at western U.S. ports are underway. The current contract expires July 1st and covers at least 15,500 longshoreman at 29 ports, including L.A. and San Diego.
Dropping stock prices combined with steadily increasing earnings have pulled valuations back near their long-term averages. There are 504 stocks in the S&P 500, totaling $37 trillion in market capitalization. If we pull out the eight largest companies from the S&P 500 (Apple, Microsoft, Google, Amazon, Tesla, Berkshire, Facebook, Nvidia), the forward P/E of the remaining 496 companies is close to 15.5 times. Ned Davis Research reports that the median forward P/E for the S&P 500 is 15 times earnings over the last 39 years. .
Special Purpose financings (SPACs), IPOs and meme stocks have all but stopped. Merger activity appears more selective. So, there is one area that may have bottomed. Market and volatility measures of sentiment are in negative territory but nowhere near a bottom. Retail investor sentiment remains negative but also not near a bottom.
News that shows inflation persisting for longer will fan worries of Fed “higher for longer” rate increases, and any break in inflation will do the opposite. Commodities that move or heat – think crude oil and natural gas – remain in inflationary uptrends. Commodities that make stuff have largely rolled over and are consolidating. Think lumber, down 64% from its year-ago peak, and copper, 7% below early March levels. The S&P 500 Steel subindex is down 25% from its April peak.
Short-term broke
The start of 2022 has been a rare year in which prices of stocks and bonds both moved south. Typically, prices of stocks and bonds move opposite of each other. As stock prices drop, traders seek safety in bonds and in risk-on environments, the opposite. Bonds are an interest claim on a company’s revenues. Stocks represent ownership in future profits, or, stated another way, future dividends. Both are discounted by interest rates. Higher interest rates, courtesy of the Fed’s inflation fighting, raise that discount, lowering prices.
Our back-of-the-envelope calculations for inflation are 8% CPI equals 2.5% “actual” inflation + 3% from supply chains + 2.5% new inflation cycle. “Actual” inflation was pre-pandemic, slowly drifting toward the Fed’s new “average around 2%.” Supply chains were all the Fed focused on last year (“transitory”). The new cycle is a result of re-shoring and smaller, more expensive work forces. If those trends slow down, the new cycle level could fall. Inflationary forces from loosening monetary policy, war and supply shortages broke the traditional stock‒bond relationship earlier this year, but as the Fed moves through its tightening cycle the relationship will shift back to its traditional role.
Less broke?
News sources out of China report local governments are easing up on lockdowns. Much of Shanghai moved to conditional lockdowns by last Tuesday. The central bank and Communist Party are ramping up a number of stimulus programs to get their economy back on a growth path. The official forecast for GDP this year is 4.5%, but that is widely regarded as “aspirational.”
The stimulus programs are fighting a two-front war: lockdowns and a bursting real estate bubble. Local stock markets are sensing the stimulus may do some good. The broad China index has rallied 13% since its mid-April low. Like other bourses, the Hang Seng has a long way to travel, another 13%, before nearing a breakout. The rally appears to have legs and may start to move our emerging markets indicators in the coming months.
Wrap-Up
We thought 2022 was going to be the year of descent – the economy slowing back toward its long-term trend growth. The Fed would help the descent along by gently raising rates and stopping its bond purchasing program.
Instead, inflation ran away from Fed, supply chains grew worse, and war returned to the world’s breadbasket. The result is a very rare few months when a blend of stocks and bonds did not work as intended. Our indicators are keeping us close to our long-term strategic allocations and patient through the summer.
Essential Economics
— Mark Frears
Who moved my peanut butter?!
Anyone else upset about the Jif peanut butter recall? At our house, we had about four jars (don’t judge) in the pantry and they were all on the list for disposal. We are now using Peter Pan; not the same. I know purists are appalled that we would use a non-natural brand, but we do. Think about the implications here. First, if I can find non-recalled Jif, it will be more expensive because of limited supply. Second, other brands will see increased demand as substitutes. A good illustration for trends we are seeing in the overall economy.
Basic economics
You may have learned, from school or experience, that generally when supply drops, price goes up, and vice-versa. One of the most talked about topics in this vein is the higher cost for gasoline, or diesel for your vehicle. For families living paycheck-to-paycheck, this will cause spending in other areas to decrease, and/or changes in behavior. Last week, the Organization of the Petroleum Exporting Countries (OPEC) agreed to increase production, but the amounts were largely symbolic.
We have also seen a shift from spending on Goods to more on Services as people emerged from the impact of the pandemic. As costs increase for both, we will watch to see if this trend continues.
Wages are another place we are seeing inflation. As employers are trying to hold on to and attract new workers, they are having to pay more. For multiple reasons, there are fewer available workers, a lack of supply.
Jobs
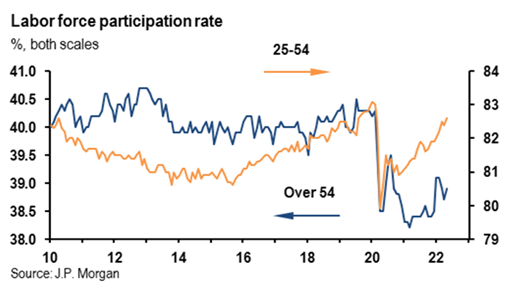
The highlight of the week, from an economic perspective, was the Nonfarm Payroll release. Given the FOMC has started to raise rates to slow the economy and more rate hikes are baked in, we did not see a material impact on hiring. We had seen eleven straight months of greater than 400,000 new jobs, and May’s release showed an additional 390,000 jobs added. Hiring continues to show a healthy economy. Month over month the unemployment rate; hours worked and wages were unchanged. Consumer’s shifts from goods to services over the last year have pushed wages higher in the hospitality sector. Conversely manufacturing wages are slowing. One place we continue to see improvement is the participation rate. Given the large number of job openings posted, we are not seeing people coming back into the workforce. As a hopeful sign, the chart below shows an upswing in the 25–54-year-old group, as well as improvement in the over 54-year-old workers.
Jobless claims continue to stay at historic low levels, confirming the strength in the job market.
The Job Openings and Labor Turnover Survey (JOLTS) still shows over eleven million job openings. This translates into almost two job openings for each unemployed person. Employers want to hire, but workers are reluctant to oblige.
Planes, trains and automobiles
The Institute of Supply Management (ISM) manufacturing index came in higher than expected, still in expansion mode at 56.1. The new orders component also rose almost 2 points this month. The Services component did fall 1.2 points in May, its lowest level since February 2021.
The Conference Board’s Consumer Confidence came in higher than expected, but down slightly from last month. Expectations were also up slightly. As you will recall, this confidence number is skewed toward job situation versus the UofM Sentiment that has a higher price/inflation focus.
Automobile sales were lower than the previous month and 11% below expectations. Commentaries were at a lack to explain this decline as demand remains strong. As you should always do, follow the trend, so we will give this another month.
Measurement
Consumer Price Index (CPI) is the most visible measure of inflation. You can look at monthly change, annual change, or core (not including food and energy) change, depending on your bent. The markets have focused on the year-over-year view lately.
The Personal Consumption Expenditures (PCE) metric also has monthly, annual and core versions. The primary thing you should be aware of is that the FOMC forecasts PCE in its quarterly Summary of Economic Projections and not CPI. It is more important to them.
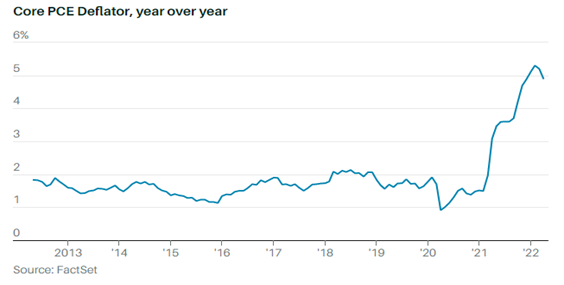
Last month, the core year-over-year CPI was 6.2% and the core year-over-year PCE deflator was 4.9%. This is a significant divergence and is attributed to differences in formulas, expenditure weights and scope effects. Three primary areas help explain the difference, and the expectation is that this divergence will continue to widen. First, the shift from goods to services causes weights in the PCE to be more impacted. This will cause more volatility. Second, when the cost of goods/services increase, we seek substitutes, like peanut butter, and the PCE metric captures these changes quicker than the CPI. Third, CPI only measures out-of-pocket expenses where PCE looks at all direct and secondary purchases made by consumers. Something for you to keep in mind as you watch the headlines. Make sure you are digging into the details and not only consuming headlines. At least read the first and last paragraphs.
Wrap-Up
We are all seeing inflation in the goods and services we buy, but this is not the 1970s. Fed Chairman Powell sees the economy as “well positioned to handle tighter monetary policy.” They have multiple tools to monitor economic strength and inflation. I wonder if they would consider adding a “peanut butter index.”
| Upcoming Economic Releases: | Period | Expected | Previous | |
|---|---|---|---|---|
| 7-Jun | Trade Balance | Apr | -$89.5B | -$109.8B |
| 7-Jun | Consumer Credit | Apr | $35.00B | $52.43B |
| 8-Jun | Wholesale Inventories MoM | Apr | 2.1% | 2.1% |
| 9-Jun | Initial Jobless Claims | 4-Jun | 206,000 | 200,000 |
| 9-Jun | Continuing Claims | 28-May | 1,305,000 | 1,309,000 |
| 10-Jun | Consumer Price Index MoM | May | 0.7% | 0.3% |
| 10-Jun | CPI ex Food & Energy MoM | May | 0.5% | 0.6% |
| 10-Jun | CPI YoY | May | 8.3% | 8.3% |
| 10-Jun | CPI ex Food & Energy YoY | May | 5.9% | 6.2% |
| 10-Jun | Real Average Weekly Earnings YoY | May | N/A | -3.4% |
| 10-Jun | UM (Go MSU) Consumer Sentiment | Jun | 58.4 | 58.4 |
| 10-Jun | UM (Go MSU) Current Conditions | Jun | 62.0 | 63.3 |
| 10-Jun | UM (Go MSU) Expectations | Jun | 54.0 | 55.2 |
| 10-Jun | UM (Go MSU) 1-Year Inflation | Jun | N/A | 5.3% |
| 10-Jun | UM (Go MSU) 5-10-Year Inflation | Jun | N/A | 3.0% |
Mark Frears is an Investment Advisor at Texas Capital Bank Private Wealth Advisors. Steve has earned the right to use the Chartered Financial Analyst and Chartered Market Technician designations. He holds a Bachelor of Science from The University of Washington, and an MBA from University of Texas – Dallas.
Steve Orr is the Executive Vice President and Chief Investment Officer for Texas Capital Bank Private Wealth Advisors. He holds a Bachelor of Arts in Economics from The University of Texas at Austin, a Master of Business Administration in Finance from Texas State University, and a Juris Doctor in Securities from St. Mary’s University School of Law. Follow him on Twitter here.
The contents of this article are subject to the terms and conditions available here.