Full Transparency — Week of November 13, 2023

Essential Economics
— Mark Frears
Full transparency
Appearances can be deceiving. I recall a time in the mid-2000s when my kids saw a huge house and asked why someone lived in a house that size. Fast forward a few years, and the residents all of a sudden no longer lived in the huge house. Opportunity for a teaching moment. While it may look like you “own” something, you have to look deeper to see if you really can afford it, and at what cost.
What areas of the economy are relying more on debt now, and what could be the impact?
You and I
Looking at the 4.9% third quarter Gross Domestic Product (GDP), two-thirds of which is driven by consumer spending, we are out buying in force. Again, we must look at the full picture to see if this is sustainable. Jobs have been plentiful and wage increases abound, but inflation is still taking a big bite out of our purchasing power. Now we have to factor in a slowing labor market and the possibility of income disruption for the spenders out there. While initial jobless claims have been staying low, as you can see below, the continuing claims number is on the rise.
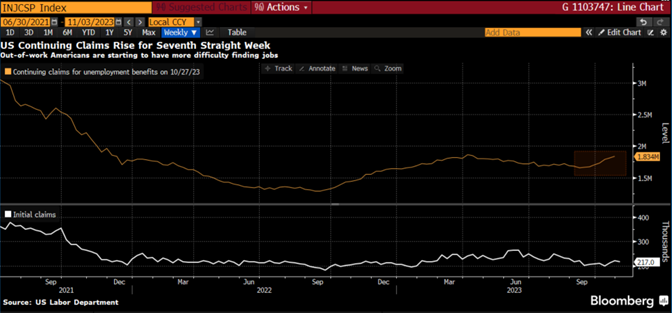
Source: Bloomberg
This is giving us a preview that the golden goose may stop laying eggs soon.
If the spending continues and wages/jobs are not providing enough to keep up the habit and fight inflation, too, then funds have to come from somewhere. The consumer had the benefit of savings built up during the pandemic, as well as locking in low mortgage rates, but those are no longer available. Therefore, borrowing is the next option.
This past week we had the NY Fed’s Q3 Household Debt and Credit Report released, showing a rise of 1.3% to $17.29 trillion. As you can see below, housing debt still makes up a majority of the debt, but non-housing is climbing at a faster rate.
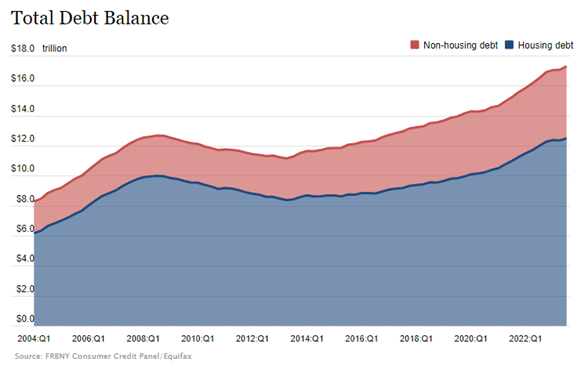
Source: FRBNY Consumer Credit Panel/Equifax
We also had the Consumer Credit release for September, which showed a less-than-expected $9.1 billion increase. This is broken out into revolving debt (credit cards primarily) and non-revolving (auto, mortgage, student loans). As you can see below, the revolving portion continued the upward trend, although on a year-over-year basis we are starting to see slowing growth.
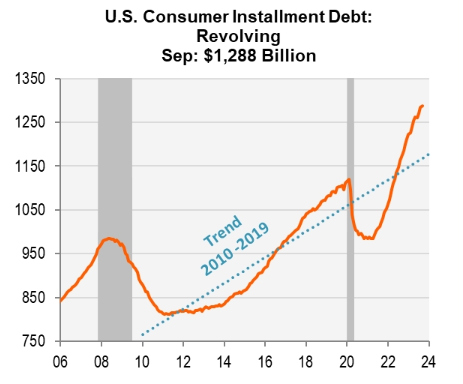
Source: Piper Sandler Research
The resumption of student loan debt payments has clouded the picture for non-revolving debt, but suffice to say, while increasing last month, balances show signs of slowing growth. The current economic environment with higher borrowing rates and tighter lending standards is expected to continue to slow the growth. Per the chart below, credit card rates are rising to even more punitive levels.
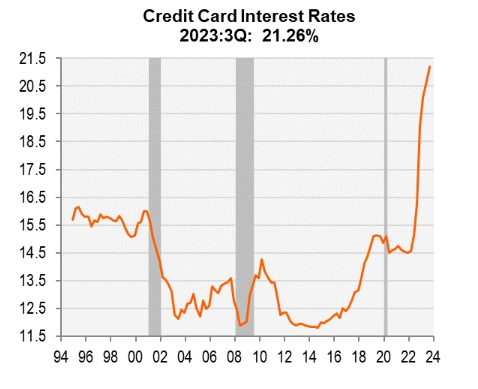
Source: Piper Sandler Research
Not to dwell on this, but I will. Even if growth is slowing, there is still a huge amount of debt that requires monthly payments. As you can see below, the stress of debt is starting to weigh on consumers.
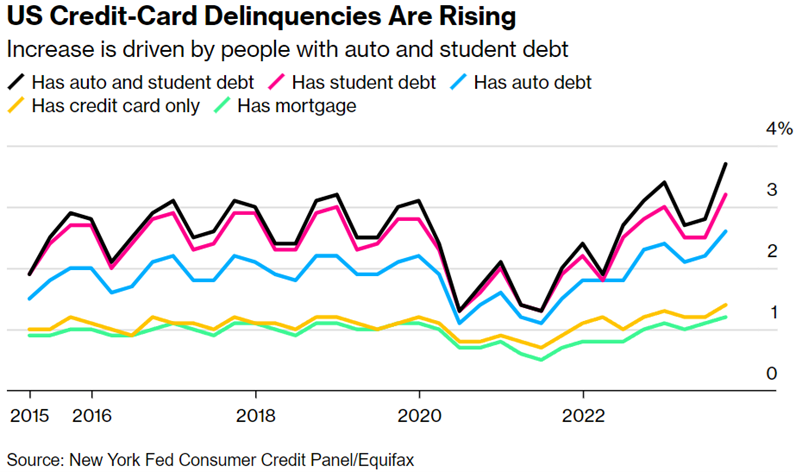
Credit cards are the quickest source of borrowing for most people and should be watched closely for signs of strain. This form of debt has grown to a record $1.1 trillion, up over $153 billion in the past year. As you would expect, those holding auto and student loans as well are having the most difficulty making their payments. We must note that all these trends are heading upwards, portraying difficulty for consumers and a slowdown in spending. This is something the FOMC is watching as they evaluate how tight financial conditions are.
Student loans are in the news a lot, as hope comes and goes as far as forgiveness. This is an additional burden for approximately 8% of the population to the tune of $300 each month. As we have seen, debt service takes money away from consumer spending.
U.S.
Speaking of debt, let’s look at the land that we love. Two weeks ago, the markets were focused on the quarterly refunding announcement, that is, how much in debt they would issue in the coming quarter. There was a big sigh of relief when they announced it would be $112 billion, versus the expected $114 billion. What was lost in the fervor was that this was the second quarter in a row of higher issuance, up $9 billion from last quarter. Traders viewed this, along with the perception that the FOMC was done raising rates as a sign that it was time to buy UST, taking yields down significantly from historical highs. This was short sighted. As you can see below, the amount of debt the U.S. is issuing continues to climb to unprecedented levels.
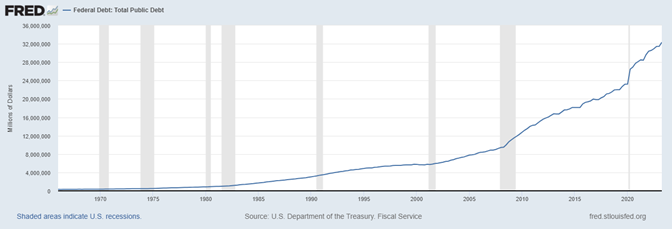
Source: U.S. Department of the Treasury: Fiscal Service
As an entity takes on more and more debt, it must be able to pay the interest on the debt, as well as hopefully pay it down at some point before it becomes unmanageable for the budget. Makes sense for you and for companies, so does this apply to the government? As you can see below, debt as a percentage of GDP (economic growth) has risen to 126% in 2020 and 119% in 2022. Is this sustainable?
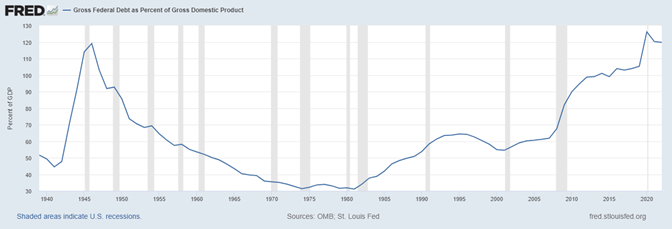
Source: OMB; St. Louis Fed
If you cannot pay down the debt, when it comes due, you have to roll it over. That is, borrow again. As you issue more and more debt, some buyers may be reluctant to hold more of your debt. They may reach a concentration constraint, or not be comfortable buying anymore. As you can see below, the U.S. has relied on foreign buyers to hold a portion of the debt, but the percentage of debt they are now holding has dropped to a 20-year low. Someone else has to pick up the slack.
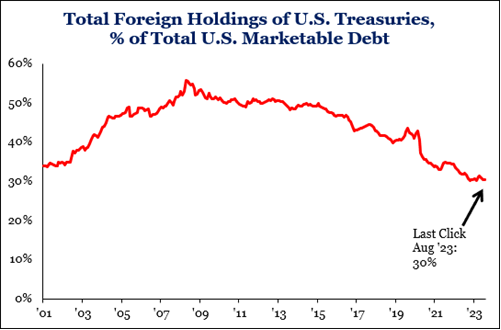
Source: Strategas Research
As you issue more debt, one way to incent buyers is to pay a higher interest rate. One consequence of the FOMC’s focus on inflation is higher short-term rates. Therefore, any issuer of debt, including the U.S. government, will have to pay a higher rate, increasing their cost. As you can see below, the combination of higher rates and issuing more debt has caused the interest expense for the U.S. to increase dramatically.
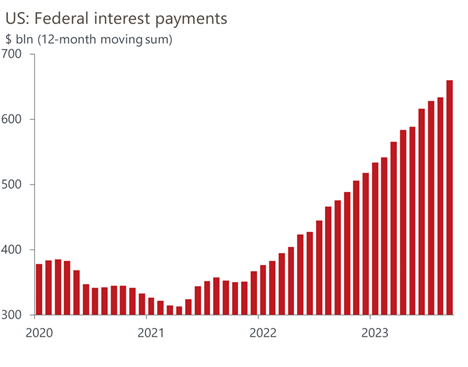
Source: Oxford Economics/Haver Analytics
To sum it up, the borrowing of the U.S. is not sustainable.
Broader impact
As consumers get tapped out from borrowing, due to tighter lending standards, expect consumer spending to slow. Recall this is two-thirds of the economic engine, therefore this will give the FOMC a slowing economy. The Fed will continue to spend and issue debt, as long as there are buyers. At some point, hopefully sooner rather than later, someone in D.C. will have to stop this madness. Fiscal spending works against monetary tightening and they need to get on the same page.
Economic releases
Last week’s calendar was very light. Consumer Credit and Sentiment were the only items of note.
This week’s calendar is packed. CPI, PPI and Retail Sales for October will catch the headlines. We also have a few housing numbers thrown in. As the week progresses, watch out for possible government shutdown on Friday. See below for details.
Wrap-Up
It is tough to live in the microwave economy where we get what we want now. Accurate valuation is important, as well as staying within your ability to repay debt. This perspective can get drowned out by the desire. Consumers need to keep this in mind before they get in too deep. The U.S. is on a dangerous spending trend with little regard for how they get the funds.
description text
| Upcoming Economic Releases: | Period | Expected | Previous | |
|---|---|---|---|---|
| 13-Nov | NY Fed 1-yr inflation expectations | Oct | N/A | 3.67% |
| 13-Nov | Monthly Budget Statement | Oct | -$65.0B | -$171.0B |
| 14-Nov | NFIB Small Business Optimism | Oct | 90.5 | 90.8 |
| 14-Nov | Consumer Price Index MoM | Oct | 0.1% | 0.4% |
| 14-Nov | CPI ex Food & Energy MoM | Oct | 0.3% | 0.3% |
| 14-Nov | Consumer Price Index YoY | Oct | 3.3% | 3.7% |
| 14-Nov | CPI ex Food & Energy YoY | Oct | 4.1% | 4.1% |
| 14-Nov | Real Avg Hourly Earnings YoY | Oct | N/A | 0.5% |
| 14-Nov | Real Avg Weekly Earnings YoY | Oct | N/A | -0.1% |
| 15-Nov | Retail Sales MoM | Oct | -0.3% | 0.7% |
| 15-Nov | Retail Sales ex Autos MoM | Oct | 0.0% | 0.6% |
| 15-Nov | Producer Price Index MoM | Oct | 0.1% | 0.5% |
| 15-Nov | PPI ex Food & Energy MoM | Oct | 0.3% | 0.3% |
| 15-Nov | Producer Price Index YoY | Oct | 1.9% | 2.2% |
| 15-Nov | PPI ex Food & Energy YoY | Oct | 2.8% | 2.7% |
| 15-Nov | Empire Manufacturing | Nov | (3.0) | (4.6) |
| 15-Nov | Business Inventories | Sep | 0.4% | 0.4% |
| 16-Nov | Initial Jobless Claims | 11-Nov | 220,000 | 217,000 |
| 16-Nov | Continuing Claims | 4-Nov | 1,853,000 | 1,834,000 |
| 16-Nov | Import Price Index MoM | Oct | -0.3% | 0.1% |
| 16-Nov | Export Price Index MoM | Oct | -0.5% | 0.7% |
| 16-Nov | NY Fed Services Business Activity | Nov | N/A | (19.1) |
| 16-Nov | Philadelphia Fed Business Outlook | Nov | (10.3) | (9.0) |
| 16-Nov | Industrial Production MoM | Oct | -0.4% | 0.3% |
| 16-Nov | Capacity Utilization | Oct | 79.4% | 79.7% |
| 16-Nov | NAHB Housing Market Index | Nov | 40 | 40 |
| 16-Nov | KC Fed Manufacturing Activity | Nov | N/A | (8) |
| 17-Nov | Building Permits | Oct | 1,450,000 | 1,473,000 |
| 17-Nov | Building Permits MoM | Oct | -1.4% | -4.4% |
| 17-Nov | Housing Starts | Oct | 1,349,000 | 1,358,000 |
| 17-Nov | Housing Starts MoM | Oct | -0.7% | 7.0% |
| 17-Nov | KC Fed Services Activity | Nov | N/A | (1) |
Mark Frears is an Senior Investment Advisor, Managing Director, at Texas Capital Bank Private Wealth Advisors. He holds a Bachelor of Science from The University of Washington, and an MBA from University of Texas – Dallas.
The contents of this article are subject to the terms and conditions available here.