Stuff — Week of October 30, 2023

Essential Economics
— Mark Frears
Here to there
When I was in college, I had a part-time job driving a truck around Seattle for the Washington Quilt Company. Picking up raw materials, dropping off finished goods to be shipped/sold, and anything else in between. Driving a stick in the city hills was no picnic, but I was able to hit my schedule most of the time.
You may have forgotten, but during the pandemic, we had a hard time getting things from point A to point B. How is the shipping industry looking now?
50,000-foot view
The N.Y. Fed has taken it upon themselves to measure the supply chain pressure, integrating manufacturing and transportation cost data. As you can see below, post pandemic, we corrected so well that we moved below the long-term average in the Global Supply Chain Pressure Index (GSCPI).
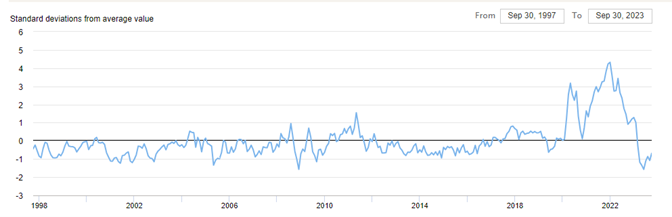
Source: NY Fed
Currently we are seeing an uptick, primarily due to continued demand and inventory building. This metric combines multiple inputs from around the globe and ties back to Producer Price Index (PPI) in the U.S. and Europe, due to contracting or loosening conditions.
Tonka
We corrected so well after the pandemic that now we are going in the other extreme. FreightWaves, a global provider of supply chain data, now estimates there are over 63,000 more trucking companies in business now than the market needs.
JB Hunt, out of Bentonville, Arkansas, announced earnings last week. In their call, they mentioned “freight recession” twenty times. Truckload rates are coming down and fewer companies will be in business before long.
Ships
While the global economy may be changing, there is still significant freight moved by ship around the world. The Baltic Dry Index is the primary sea freight index measuring the cost of shipping goods worldwide. As you can see below, this index has been dropping hard since October 18, reflecting a perceived weaker economy.
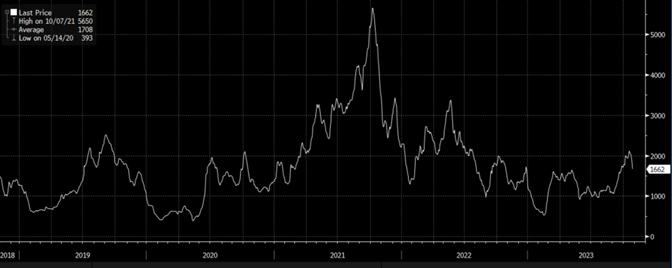
Source: Bloomberg
USD
If you are talking global trade, you have to consider the United States Dollar (USD). The strength of the dollar makes it more affordable for people using USD to buy goods from other countries. As you can see below, while off the peak, the USD is still in a very strong position.
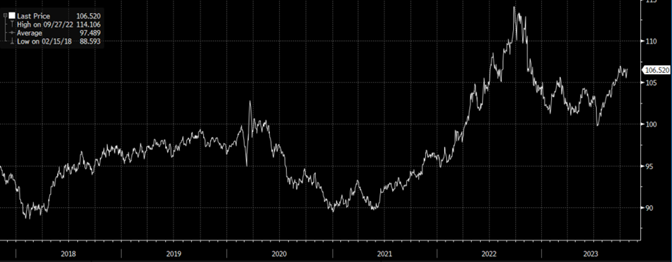
Source: Bloomberg
Even in the face of strong U.S. growth, the expected slowdown should not impact the strength of the USD; it still looks better than other major trading powers. Watch that deficit though.
Inflation impact
The mix change between goods and services is also helping to drive down demand and costs in this area. The desire to pursue experiences versus stuff drives increasing costs in the service sector and the opposite in the goods sector. Once goods became available, post pandemic, the means to get them to us improved to the point that it is so efficient that we now have too many providers. This will help overall inflation, but the percentage of GDP tied to goods is significantly smaller than services, so impact will be less.
Economic releases
Last week’s calendar showed a strong economy, yet consumer confidence falling. New Home Sales, GDP, Durable Goods and Personal Spending were all above expectations. UM Consumer Sentiment fell, driven by continued higher prices. The Fed’s favorite inflation measure, PCE, continued a slowing trend.
This week we have Consumer Confidence, ISM for manufacturing and services, payroll-related releases, and the FOMC on Wednesday. See below for details.
Wrap-Up
Driving batting and sleeping bags around town was kind of fun, and I still have a couple of those bags around. If I was looking for a job now, this would not be an area of strong prospects, but it could help lower some costs, helping out the FOMC.
| Upcoming Economic Releases: | Period | Expected | Previous | |
|---|---|---|---|---|
| 30-Oct | Dallas Fed Manufacturing Activity | Oct | (16.0) | (18.1) |
| 31-Oct | Employment Cost Index | Q3 | 1.0% | 1.0% |
| 31-Oct | FHFA House Price Index MoM | Aug | 0.5% | 0.8% |
| 31-Oct | S&P CoreLogic 20-City YoY NSA | Aug | 1.60% | 0.13% |
| 31-Oct | MNI Chicago PMI | Oct | 45.0 | 44.1 |
| 31-Oct | Conf Board Consumer Confidence | Oct | 100.0 | 103.0 |
| 31-Oct | Conf Board Present Situation | Oct | N/A | 147.1 |
| 31-Oct | Conf Board Expectations | Oct | N/A | 73.7 |
| 31-Oct | Dallas Fed Services Activity | Oct | N/A | (8.6) |
| 1-Nov | ADP Employment Change | Oct | 150,000 | 89,000 |
| 1-Nov | Construction Spending MoM | Sep | 0.4% | 0.5% |
| 1-Nov | JOLTS Job Openings | Sep | 9,265,000 | 9,610,000 |
| 1-Nov | ISM Manufacturing | Oct | 49.0 | 49.0 |
| 1-Nov | ISM Manuf Prices Paid | Oct | 45.0 | 43.8 |
| 1-Nov | ISM Manuf Employment | Oct | N/A | 51.2 |
| 1-Nov | ISM Manuf New Orders | Oct | N/A | 49.2 |
| 1-Nov | FOMC Rate Decision (Upper Bound) | 1p CT | 5.50% | 5.50% |
| 1-Nov | FOMC Rate Decision (Lower Bound) | 1p CT | 5.25% | 5.25% |
| 1-Nov | Ward’s Total Vehicle Sales | Oct | 15,500,000 | 15,670,000 |
| 2-Nov | Challenger Job Cuts YoY | Oct | N/A | 58.2% |
| 2-Nov | Nonfarm Productivity | Q3 | 4.3% | 3.5% |
| 2-Nov | Unit Labor Costs | Q3 | 0.7% | 2.2% |
| 2-Nov | Initial Jobless Claims | 28-Oct | 210,000 | 210,000 |
| 2-Nov | Continuing Claims | 21-Oct | 1,780,000 | 1,790,000 |
| 2-Nov | Factory Orders | Sep | 1.9% | 1.2% |
| 2-Nov | Factory Orders ex Transportation | Sep | N/A | 1.4% |
| 3-Nov | Change in Nonfarm Payrolls | Oct | 190,000 | 336,000 |
| 3-Nov | Change in Private Payrolls | Oct | 150,000 | 263,000 |
| 3-Nov | Unemployment Rate | Oct | 3.8% | 3.8% |
| 3-Nov | Avg Hourly Earnings MoM | Oct | 0.3% | 0.2% |
| 3-Nov | Avg Hourly Earnings YoY | Oct | 4.0% | 4.2% |
| 3-Nov | Labor Force Participation Rate | Oct | 62.8% | 62.8% |
| 3-Nov | Underemployment Rate | Oct | N/A | 7.0% |
| 3-Nov | ISM Services Index | Oct | 53.0 | 53.6 |
| 3-Nov | ISM Services Prices Paid | Oct | N/A | 58.9 |
| 3-Nov | ISM Services Employment | Oct | N/A | 53.4 |
| 3-Nov | ISM Services New Orders | Oct | N/A | 51.8 |
Mark Frears is a Senior Investment Advisor, Managing Director, at Texas Capital Bank Private Wealth Advisors. He holds a Bachelor of Science from The University of Washington, and an MBA from University of Texas – Dallas.
The contents of this article are subject to the terms and conditions available here.