Money makes the consumer happy — Week of October 23, 2023

Essential Economics
— Mark Frears
What is changing?
Last week I was up in Canada, helping my brother close up the family cottage for the winter. After chainsawing numerous logs, putting away outside furniture and attaching tarps to exposed screens, we moved the floating dock around to a more protected location. We also pulled the water line from the lake, to avoid it being damaged in the freezing temperatures. If you want water now, it is a bucket from the lake, and boil it on the stove. We can get so accustomed to easy access to resources.
The consumer has had easy access to money, through pandemic stimulus, rising wages and strong employment prospects. As monetary conditions have tightened, how are they doing now?
Attitude
The most recent indicator on the consumer’s confidence level was the UofM release. This showed a sharp drop in October of 5.1 points, a larger decline than expected. As you may recall, this confidence measure is weighted towards inflation expectations, and this would tell us that expectations for higher prices are not going away.
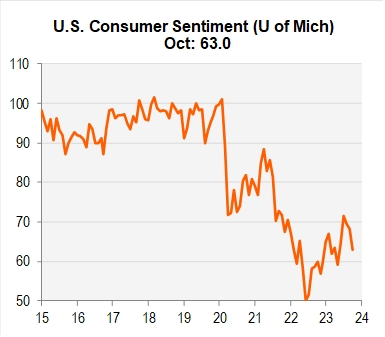
Source: Piper Sandler
The Current Conditions and Expectations components of the survey are presented below. As you can see, both short- and long-term views are headed lower.
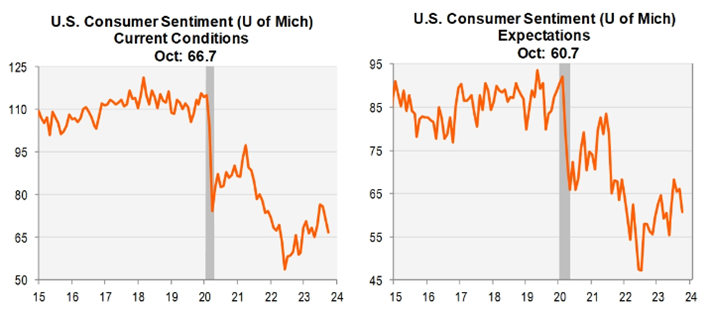
Source: Piper Sandler
How does this confidence drop play out in actual consumer behavior?
Want or need?
So far, the lower confidence levels are not impacting spending. As you can see below, Retail Sales in September rose a higher than expected 0.7%, with upward revisions to July and August.
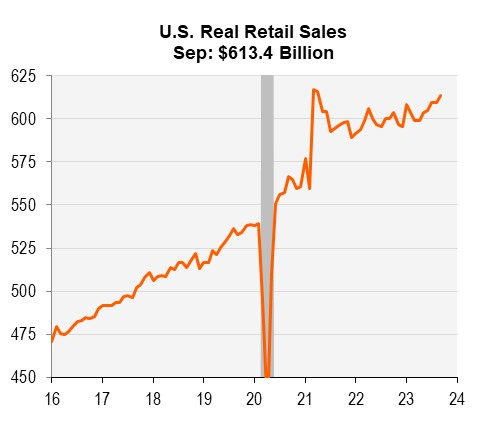
Source: Piper Sandler
This report confirms the stronger-than-expected momentum in the third quarter may carry on into pre-Christmas sales. Retail Sales year-to-date are up 3.8% following a reading of up 9.7% in 2022.
One of the areas that showed strong growth was car sales. This can be seen in the monthly payments, below.

Source: Edumnds
Three years ago, less than 7% of buyers paid over $1,000 each month, versus 17.5% now. This does not seem to be sustainable.
Based on this strong momentum, Gross Domestic Product (GDP) for the third quarter is expected to be very strong. As you can see below, the Blue Chip Consensus is for 3.5% and the Atlanta GDPNow is over 5%. Not seeing that recession yet.
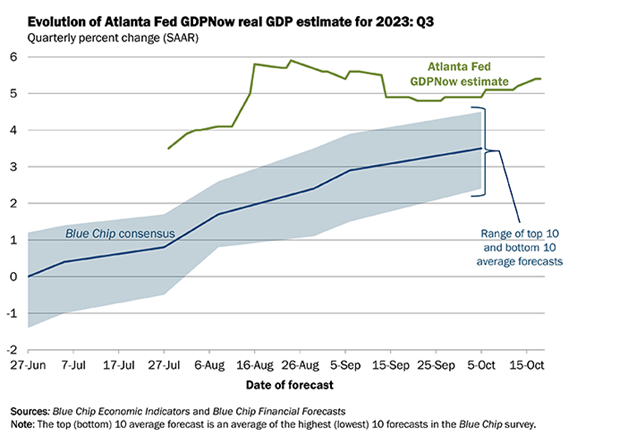
Source: Atlanta Fed
So far, we are not seeing the consumer staple and discretionary company stocks come off their 52-week lows. This is an indicator as to when the consumer will start to change their behavior.
Jobs
In order for the consumer to spend, they must stay employed. We have continued to see strong payroll growth, although at a slower pace than last year. The claims for unemployment insurance are a good indicator to keep an eye on. While weekly claims have stayed close to 200,000, we are starting to see a pickup in continuing claims or total number of people who have filed.
As you can see below, on a state level, we are seeing a significant increase in claims.
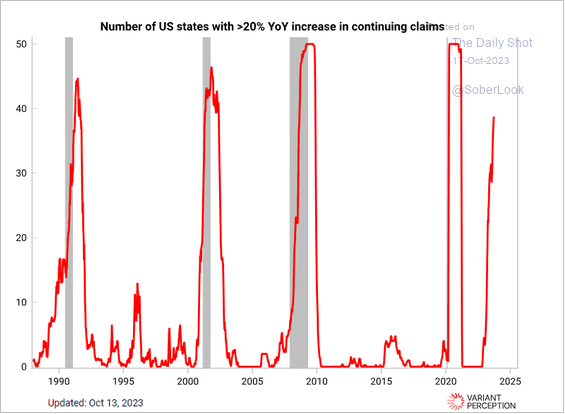
Source: The Daily Shot
Home sweet home?
People in the market for new living quarters are facing a double whammy right now. First, as long-term rates have risen, mortgage rates make it more expensive to buy. In addition, as you can see below, the annual income needed to afford a typical home has skyrocketed.
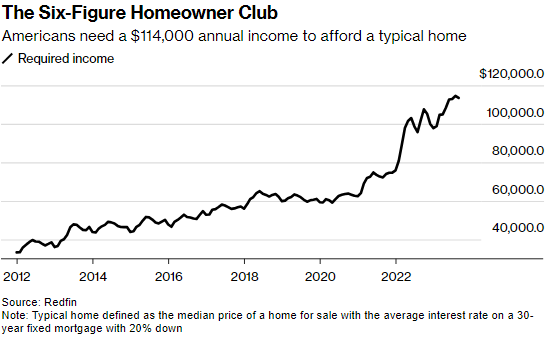
Source: Redfin
Imbalance is the name of the game, in housing, even more than the labor market. As costs to both the buyer and the builder have risen, supply is not increasing, even in the face of steady demand. Although we have a strong consumer, these levels will preclude availability for a portion of the population.
Underlying strength
Along with better incoming cash flow, the consumer came out of the pandemic with a stronger balance sheet. Specifically, this means they were able to pay down debt and lock in lower mortgage rates. So, as rates have risen, they have not been as impacted.
As you can see below in the chart from the Fed Survey on Consumer Finances, the median household net worth is up 37% from 2019 to 2022. In addition, the median household debt service as share of income fell to 13.4%, a 33-year low!
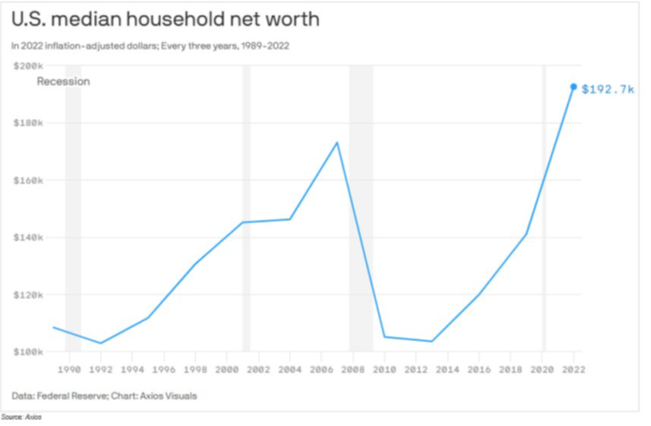
Source: Axios
Now, they are getting itchy to make major purchases, and/or borrow again. This is a different interest rate world, though. According to a more recent New York Fed Survey, the perceived availability of credit for U.S. consumers fell to the lowest level in over a decade. That won’t make it easy to make those purchases. In addition, the same survey showed consumers more likely to miss a debt payment. The tighter monetary conditions may be starting to impact behavior!
Economic releases
Last week’s calendar was highlighted by rising retail sales, but the attention was diverted to the Middle East conflict and the dysfunction of Washington D.C.
This week we have PMIs, home sales, Q3 GDP, PCE, Durables and UofM final confidence numbers. The November FOMC meeting is coming up October 31–November 1. See below for details.
Wrap-Up
Unlike the water from the lake, which will freeze solid later this year, the consumer’s access to cash resources could still have limited movement, yet the cost may be prohibitive.
| Upcoming Economic Releases: | Period | Expected | Previous | |
|---|---|---|---|---|
| 23-Oct | Chicago Fed Natl Activity Index | Sep | (0.14) | 0.12 |
| 24-Oct | Philadelphia Fed Non-Manuf Activity | Oct | N/A | (16.6) |
| 24-Oct | S&P Global US Manufacturing PMI | Oct | 49.4 | 49.8 |
| 24-Oct | S&P Global US Services PMI | Oct | 49.9 | 50.1 |
| 24-Oct | S&P Global US Composite PMI | Oct | 50.0 | 50.2 |
| 24-Oct | Richmond Fed Manufacturing Index | Oct | 3 | 5 |
| 24-Oct | Richmond Fed Business Conditions | Oct | N/A | (5) |
| 25-Oct | New Home Sales | Sep | 682,000 | 675,000 |
| 25-Oct | New Home Sales MoM | Sep | 1.0% | -8.7% |
| 26-Oct | Wholesale Inventories MoM | Sep | 0.1% | -0.1% |
| 26-Oct | GDP Annualized QoQ | Q3 | 4.3% | 2.1% |
| 26-Oct | Personal Consumption | Q3 | 4.0% | 0.8% |
| 26-Oct | GDP Price Index | Q3 | 2.7% | 1.7% |
| 26-Oct | Durable Goods Orders | Sep | 1.5% | 0.1% |
| 26-Oct | Durable Goods ex Transportation | Sep | 0.3% | 0.4% |
| 26-Oct | Cap Goods Orders Nondef ex Aircraft | Sep | 0.0% | 0.9% |
| 26-Oct | Initial Jobless Claims | 21-Oct | 208,000 | 198,000 |
| 26-Oct | Continuing Claims | 14-Oct | 1,738,000 | 1,734,000 |
| 26-Oct | Pending Home Sales MoM | Sep | -1.6% | -7.1% |
| 26-Oct | KC Fed Manufacturing Activity | Oct | N/A | (8) |
| 27-Oct | Personal Income | Sep | 0.4% | 0.4% |
| 27-Oct | Personal Spending | Sep | 0.5% | 0.4% |
| 27-Oct | Real Personal Spending | Sep | 0.3% | 0.1% |
| 27-Oct | PCE Deflator YoY | Sep | 3.4% | 3.5% |
| 27-Oct | PCE Core Deflator YoY | Sep | 3.7% | 3.9% |
| 27-Oct | UM (Go MSU) Consumer Sentiment | Oct | 63.0 | 63.0 |
| 27-Oct | UM (Go MSU) Current Conditions | Oct | N/A | 66.7 |
| 27-Oct | UM (Go MSU) Expectations | Oct | N/A | 60.7 |
| 27-Oct | UM (Go MSU) 1-yr inflation | Oct | 3.8 | 3.8% |
| 27-Oct | UM (Go MSU) 5- to 10-yr inflation | Oct | N/A | 3.0% |
| 27-Oct | KC Fed Services Activity | Oct | N/A | 2 |
Mark Frears is a Senior Investment Advisor, Managing Director, at Texas Capital Bank Private Wealth Advisors. He holds a Bachelor of Science from The University of Washington, and an MBA from University of Texas – Dallas.
The contents of this article are subject to the terms and conditions available here.